| Market Summary | Weekly Breakout Report | Top Breakout Choices | Top 2nd Chances | New Features | Tip of the Week |

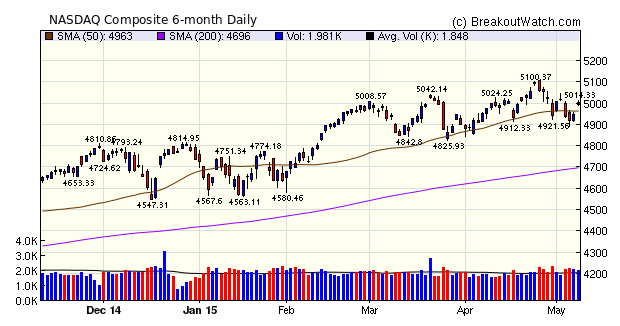
The market trended down for the first three days causing our trend signals to turn down for all three major indexes on Thursday. Friday brought a sharp turn around as the UK election results brought a surprise victory for the Conservatives and Friday's employment report showed employers added 223,000 new jobs in April beating the consensus estimate of 218,000. Wage growth was minimal, however, which is expected to provide further reason for the Fed to hold off on an interest rate rise. The one day rally was insufficient to reverse our trend signals which remain down.
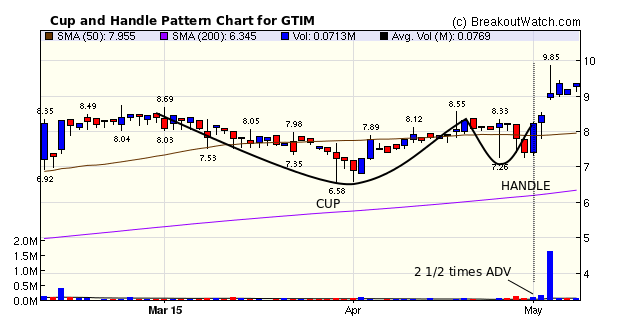
The breakout of the week was Good Times Restaurants from a cup and handle pattern base. We issued an alert at 1:29 pm on Monday for GTIM when priced at 8.35 which could have been purchased before closing for the day at 8.44. The stock gapped-up on Tuesday and closed at 9.35 on Friday for a gain of 12% over our alert price. This breakout could have been seen as a near certainty as we explain below.
| Breakouts for Week Beginning 05/04/15 | |||||||||
| Brkout Date | Symbol | Base | Squeeze | BrkoutOut Price | Brkout Day Close | RS Rank* | Last Close | Current % off BOP | Gain at Intraday High |
|---|---|---|---|---|---|---|---|---|---|
| 05/04/15 | GTIM | CwH | N | 8.30 | 8.44 | 97 | 9.35 | 12.65 | 18.67 |
| 05/08/15 | SSNI | SQZ | Y | 10.66 | 11.95 | 83 | 11.95 | 12.10 | 12.1 |
| 05/08/15 | IMPV | CwH | N | 49.39 | 53.98 | 95 | 53.98 | 9.29 | 9.29 |
| 05/04/15 | BSFT | HTF | N | 35.85 | 37.63 | 91 | 34.63 | -3.40 | 7.25 |
| 05/08/15 | DATA | CwH | N | 103.40 | 110.69 | 91 | 110.69 | 7.05 | 7.05 |
| 05/06/15 | POWR | SQZ | Y | 14.04 | 14.19 | 94 | 14.16 | 0.85 | 5.56 |
| 05/04/15 | ATHM | CwH | N | 53.31 | 55.02 | 94 | 50.09 | -6.04 | 5.51 |
| 05/04/15 | AMCX | HTF | N | 77.27 | 80.02 | 86 | 76.25 | -1.32 | 5.01 |
| 05/08/15 | NRG | HSB | N | 25.20 | 26.40 | 16 | 26.4 | 4.76 | 4.76 |
| 05/06/15 | NRG | HSB | N | 25.24 | 24.59 | 13 | 26.4 | 4.60 | 4.6 |
| 05/04/15 | MATR | CwH | N | 7.17 | 7.20 | 0 | 6.95 | -3.07 | 4.46 |
| 05/07/15 | PLCE | SQZ | Y | 66.08 | 68.61 | 90 | 69.01 | 4.43 | 4.43 |
| 05/04/15 | RGR | CwH | N | 56.37 | 58.56 | 85 | 55.77 | -1.06 | 4.26 |
| 05/07/15 | ATSG | SQZ | Y | 10.01 | 10.12 | 79 | 10.29 | 2.80 | 2.8 |
| 05/07/15 | ICE | SQZ | Y | 232.24 | 233.26 | 75 | 238.24 | 2.58 | 2.58 |
| 05/08/15 | SPCB | CwH | N | 12.74 | 13.03 | 94 | 13.03 | 2.28 | 2.28 |
| 05/04/15 | OZM | SQZ | Y | 13.21 | 13.3 | 76 | 12.7 | -3.86 | 2.12 |
| 05/04/15 | NDSN | SQZ | Y | 80.78 | 81.63 | 71 | 81.69 | 1.13 | 1.67 |
| 05/08/15 | ICE | SQZ | Y | 234.76 | 238.24 | 74 | 238.24 | 1.48 | 1.48 |
| 05/07/15 | WEN | SQZ | Y | 11.06 | 11.19 | 87 | 11.08 | 0.18 | 1.36 |
| 05/08/15 | LENS | SQZ | Y | 8.82 | 8.84 | 90 | 8.84 | 0.23 | 0.23 |
| 05/06/15 | TAXI | HSB | Y | 10.73 | 10.62 | 32 | 10.61 | -1.12 | 0.19 |
| 05/08/15 | ESNT | CwH | N | 26.00 | 26.00 | 81 | 26 | 0.00 | 0 |
| Weekly Average (23 breakouts) | 2.02 | 4.68 | |||||||
| *RS Rank on day before breakout. | |||||||||
No new features this week.
Lessons
from a High Volume Handle in a Cup and Handle Pattern
The breakout of GTIM was occasioned by the announcement on May 4 of a stock offering for the purpose of buying Bad Daddy's Burger Bar. In hindsight, we can see that Trading in GTIM on the day before breakout was a near certain indicator that insiders were buying in anticipation of the announcement. After a two day sell-off (probably by insiders to force the price down), the price surged up on Friday May 1 on 2 1/2 times average volume. This kind of action in the handle with a sell-off followed by a rise on higher volume, is text book behavior, but rarely do we see the indications that a breakout is coming as clearly as it was signaled here. At the next session (May 4) volume surged again to 10 times ADV and as we mentioned above, the stock could have been bought on the alert before the end of day at up to 8.44.
We mention the importance positive price and volume performance in the handle in our Cap and Handle Methodology page and highlighted it as long ago as 2005.
"After the price has stabilized
(in the handle) it is not uncommon to see the price begin to
rise on higher volume. This is an indication that institutions
are starting to nibble and may indicate a strong breakout to
come. We have noticed that breakouts are 17% stronger, on
average, when the price and volume rise on the day before the
breakout. See our newsletter
of 4/23/05."

| Index | Value | Change Week | Change YTD | Trend | ||||||||||||||||||||||||||||||||||||
|---|---|---|---|---|---|---|---|---|---|---|---|---|---|---|---|---|---|---|---|---|---|---|---|---|---|---|---|---|---|---|---|---|---|---|---|---|---|---|---|---|
| Dow | 18191.1 | 0.93% | 2.06% | Down | ||||||||||||||||||||||||||||||||||||
| NASDAQ | 5003.55 | -0.04% | 5.65% | Down | ||||||||||||||||||||||||||||||||||||
| S&P 500 | 2116.1 | 0.37% | 2.78% | Down | ||||||||||||||||||||||||||||||||||||
1The Market Signal is derived
from our proprietary market model. The market model is
described on the site.
2The site also shows industry rankings based on fundamentals, combined technical and fundamentals, and on price alone. The site also shows daily industry movements. |
||||||||||||||||||||||||||||||||||||||||
|
Category
|
Symbol
|
Company Name
|
Expected Gain1
|
|---|---|---|---|
| Best Overall | PMFG | PMFG, Inc. | 119 |
| Top Technical | PMFG | PMFG, Inc. | 119 |
| Top Fundamental | GTN | Gray Television, Inc. | 66 |
| Top Tech. & Fund. | HQY | HealthEquity, Inc. | 52 |
|
Category
|
Symbol
|
Company Name
|
Expected Gain1
|
|---|---|---|---|
| Best Overall | MATR | Mattersight Corporation | 96 |
| Top Technical | ATHM | Autohome Inc. | 45 |
| Top Fundamental | ATHM | Autohome Inc. | 45 |
| Top Tech. & Fund. | ATHM | Autohome Inc. | 45 |
If you received this newsletter from a friend and you would like to receive it regularly please go to the BreakoutWatch.com site and enter as a Guest. You will then be able to register to receive the newsletter.
Copyright © 2015 NBIcharts, LLC dba BreakoutWatch.com. All rights
reserved.
" BreakoutWatch," the BreakoutWatch.com "eye" logo, and the slogan
"tomorrow's breakouts today" are service marks of NBIcharts LLC.
All other marks are the property of their respective owners, and
are used for descriptive purposes only.
BreakoutWatch is not affiliated with Investor's Business Daily or
with Mr. William O'Neil. Our site, research and analysis is
supported entirely by subscription and is free from advertising.