| Market Summary | Weekly Breakout Report | Top Breakout Choices | Top 2nd Chances | New Features | Tip of the Week |
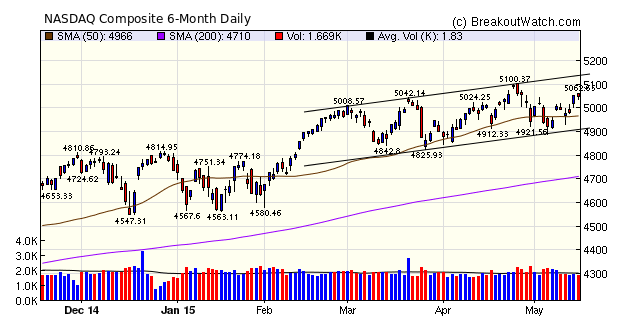
The NASDAQ Composite was saved by Thursday's accumulation day in an otherwise negative week. Thursday's close, on volume that barely met the 50 day average, left the index with just enough cushion to avoid being dragged into the red by Friday's small loss. Overall, the index was the top performer of the major three, with a gain of 0.9% for the week. The S&P 500 set a new all-time high and if the NASDAQ trend continues as shown in the chart, then the NASDAQ may also set a new high in the near future.
Market conditions created an usually large number of volatility squeeze situations early in the week which led to an unusually large number (48) of Volatility Squeeze (SQZ) breakouts.
| Breakouts for Week Beginning 05/11/15 | |||||||||
| Brkout Date | Symbol | Base | Squeeze | BrkoutOut Price | Brkout Day Close | RS Rank* | Last Close | Current % off BOP | Gain at Intraday High |
|---|---|---|---|---|---|---|---|---|---|
| 05/14/15 | SSNI | CwH | N | 12.01 | 13.03 | 91 | 13.66 | 13.74 | 13.74 |
| 05/12/15 | RARE | CwH | N | 70.69 | 72.27 | 94 | 79.33 | 12.22 | 12.3 |
| 05/14/15 | PERY | SQZ | Y | 24.04 | 26.09 | 84 | 26.76 | 11.31 | 11.52 |
| 05/12/15 | PAHC | SQZ | Y | 34.04 | 36.73 | 95 | 36.46 | 7.11 | 7.9 |
| 05/14/15 | CTRP | CwH | Y | 67.46 | 71.14 | 88 | 71.99 | 6.72 | 6.79 |
| 05/14/15 | TOUR | CwH | N | 18.80 | 19.35 | 88 | 19.97 | 6.22 | 6.38 |
| 05/14/15 | SGU | SQZ | Y | 7.50 | 7.75 | 79 | 7.97 | 6.27 | 6.27 |
| 05/15/15 | SRNE | CwH | N | 12.43 | 13.04 | 97 | 13.04 | 4.91 | 5.07 |
| 05/13/15 | IT | SQZ | Y | 83.79 | 86.2 | 71 | 87.46 | 4.38 | 5.07 |
| 05/12/15 | PFSW | CwH | N | 13.12 | 13.49 | 92 | 13.78 | 5.03 | 5.07 |
| 05/12/15 | OZRK | SQZ | Y | 40.55 | 41.39 | 70 | 41.98 | 3.53 | 4.96 |
| 05/12/15 | HAWK | SQZ | Y | 36.20 | 37.04 | 78 | 37.94 | 4.81 | 4.89 |
| 05/13/15 | MCK | SQZ | Y | 229.64 | 232.38 | 79 | 240 | 4.51 | 4.53 |
| 05/13/15 | AGO | SQZ | Y | 27.53 | 27.65 | 76 | 28.76 | 4.47 | 4.5 |
| 05/14/15 | CRTO | CwH | N | 46.42 | 47.50 | 92 | 48.27 | 3.99 | 4.18 |
| 05/12/15 | RPTP | SQZ | Y | 10.93 | 11.14 | 82 | 11.3 | 3.39 | 3.66 |
| 05/14/15 | NI | SQZ | Y | 43.94 | 44.16 | 76 | 45.47 | 3.48 | 3.53 |
| 05/14/15 | BVN | SQZ | Y | 11.95 | 12.37 | 76 | 12.265 | 2.64 | 3.51 |
| 05/14/15 | MCK | SQZ | Y | 232.37 | 239.48 | 81 | 240 | 3.28 | 3.3 |
| 05/15/15 | SGU | SQZ | Y | 7.72 | 7.97 | 81 | 7.97 | 3.24 | 3.24 |
| 05/14/15 | IMPV | CwH | N | 54.69 | 55.63 | 97 | 56.46 | 3.24 | 3.24 |
| 05/15/15 | AEIS | SQZ | Y | 26.99 | 27.81 | 89 | 27.81 | 3.04 | 3.19 |
| 05/15/15 | EDN | SQZ | Y | 15.33 | 15.81 | 93 | 15.81 | 3.13 | 3.13 |
| 05/14/15 | ADBE | SQZ | Y | 77.08 | 79.43 | 74 | 78.9 | 2.36 | 3.05 |
| 05/14/15 | MED | SQZ | Y | 31.94 | 32.83 | 71 | 32.62 | 2.13 | 2.79 |
| 05/14/15 | TW | SQZ | Y | 131.36 | 134.75 | 77 | 134.7 | 2.54 | 2.63 |
| 05/14/15 | ANSS | SQZ | Y | 88.22 | 90.48 | 74 | 89.63 | 1.60 | 2.56 |
| 05/12/15 | SIVB | SQZ | Y | 133.73 | 134.07 | 83 | 132.71 | -0.76 | 2.44 |
| 05/12/15 | EMKR | CwH | N | 6.11 | 6.15 | 91 | 6.25 | 2.29 | 2.29 |
| 05/14/15 | IT | SQZ | Y | 86.23 | 88.04 | 76 | 87.46 | 1.43 | 2.1 |
| 05/13/15 | SIVB | SQZ | Y | 134.20 | 136.11 | 83 | 132.71 | -1.11 | 2.08 |
| 05/12/15 | WBS | SQZ | Y | 37.29 | 37.58 | 84 | 37.45 | 0.43 | 2.06 |
| 05/13/15 | PLXS | SQZ | Y | 44.27 | 44.6 | 73 | 44.57 | 0.68 | 1.97 |
| 05/15/15 | CUBE | SQZ | Y | 24.06 | 24.465 | 80 | 24.465 | 1.68 | 1.7 |
| 05/13/15 | BKU | SQZ | Y | 33.65 | 34.06 | 71 | 33.75 | 0.30 | 1.66 |
| 05/15/15 | EMKR | CwH | N | 6.15 | 6.25 | 93 | 6.25 | 1.63 | 1.63 |
| 05/12/15 | LGIH | SQZ | Y | 17.71 | 17.96 | 80 | 17.75 | 0.23 | 1.41 |
| 05/14/15 | ENS | SQZ | Y | 68.43 | 69.36 | 73 | 69.23 | 1.17 | 1.36 |
| 05/13/15 | KEY | SQZ | Y | 14.74 | 14.92 | 71 | 14.69 | -0.34 | 1.29 |
| 05/14/15 | AFFX | SQZ | Y | 12.37 | 12.52 | 90 | 12.46 | 0.73 | 1.21 |
| 05/14/15 | PLXS | SQZ | Y | 44.60 | 45.14 | 76 | 44.57 | -0.07 | 1.21 |
| 05/14/15 | COLB | SQZ | Y | 30.16 | 30.51 | 78 | 29.85 | -1.03 | 1.16 |
| 05/14/15 | SEE | CwH | N | 48.81 | 49.37 | 88 | 48.93 | 0.25 | 1.15 |
| 05/14/15 | AWI | SQZ | Y | 55.86 | 56.5 | 71 | 56.12 | 0.47 | 1.15 |
| 05/14/15 | TCO | HTF | N | 75.69 | 76.51 | 46 | 76.52 | 1.10 | 1.14 |
| 05/12/15 | FLY | SQZ | Y | 15.06 | 15.17 | 74 | 15.16 | 0.66 | 1.13 |
| 05/14/15 | TEL | SQZ | Y | 69.48 | 70.12 | 72 | 70.21 | 1.05 | 1.07 |
| 05/13/15 | ILMN | SQZ | Y | 197.12 | 198.23 | 78 | 198.97 | 0.94 | 1.06 |
| 05/14/15 | EGBN | SQZ | Y | 38.69 | 39.09 | 75 | 38.88 | 0.49 | 1.03 |
| 05/13/15 | BXS | SQZ | Y | 24.52 | 24.66 | 77 | 24.365 | -0.63 | 1.02 |
| 05/12/15 | CRF | SQZ | Y | 23.54 | 23.75 | 98 | 23.236 | -1.29 | 0.89 |
| 05/12/15 | CNO | SQZ | Y | 18.48 | 18.62 | 71 | 18.155 | -1.76 | 0.76 |
| 05/14/15 | KWEB | CwH | N | 40.97 | 41.04 | 80 | 41.27 | 0.73 | 0.73 |
| 05/14/15 | BECN | SQZ | Y | 31.31 | 31.54 | 70 | 31.48 | 0.54 | 0.73 |
| 05/14/15 | SIVB | SQZ | Y | 136.13 | 136.99 | 86 | 132.71 | -2.51 | 0.63 |
| 05/14/15 | BKU | SQZ | Y | 34.06 | 34.21 | 72 | 33.75 | -0.91 | 0.44 |
| 05/14/15 | MSFG | SQZ | Y | 19.98 | 20.06 | 75 | 19.84 | -0.70 | 0.4 |
| 05/14/15 | CSBK | SQZ | Y | 13.99 | 14.04 | 74 | 13.97 | -0.14 | 0.36 |
| 05/14/15 | WSBF | SQZ | Y | 13.00 | 13.04 | 73 | 12.94 | -0.46 | 0.31 |
| 05/12/15 | CSBK | SQZ | Y | 14.02 | 14.05 | 73 | 13.97 | -0.36 | 0.21 |
| 05/15/15 | LO | HTF | N | 72.09 | 72.15 | 80 | 72.15 | 0.08 | 0.15 |
| 05/14/15 | CPF | SQZ | Y | 22.98 | 22.98 | 79 | 22.96 | -0.09 | -0 |
| Weekly Average (62 breakouts) | 2.23 | 2.92 | |||||||
| *RS Rank on day before breakout. | |||||||||
Threshold RS for Volatility Squeeze Raised to 80
While looking at the reason for the large number of Volatility Squeeze alerts and breakouts, I became aware that we were publishing stocks on this watchlist with an RS rank as low as 70. I have now raised the threshold to 80 which reduces the number substantially. For example, on Wednesday there were 114 stocks on the SQZ list which fell to 40 on Thursday after I implemented the higher threshold level.
FREE! Get Top Cup and Handle Pattern Stocks on our Home Page
You don't have to be a subscriber to our site to get valuable stock information on a daily basis.
- Top Ranked Cup and Handle
Pattern Stocks
Each day we publish five highly ranked stocks from our cup and handle pattern watchlist. These are stocks that could potentially breakout at the next session. By clicking the symbol you can see a chart clearly showing the cup and handle pattern. For example, as of Friday, May 15 our picks are:
| Symbol | RS Rank | Breakout Price | Breakout Volume |
|---|---|---|---|
| TNK | 95 | 6.89 | 1,651,563 |
| MRTX | 95 | 32.17 | 122,512 |
| GLUU | 95 | 7.03 | 6,128,836 |
| VSLR | 95 | 14.97 | 1,791,724 |
| NSP | 95 | 55.11 | 273,226 |
- Yesterday's Successful
Breakouts
Each day we publish all of the successful breakouts from the previous session. These are stocks that you could still buy, but look at the movement since breakout first. Again, you can see the chart pattern by clicking the symbol in the table. Here's yesterday's breakouts:
| Symbol | Alert Time | Breakout Price | Close | % Gain at Close |
|---|---|---|---|---|
| SRNE | 10:31:11 | 12.43 | 13.04 | 4.91 |
| EMKR | 09:45:23 | 6.15 | 6.25 | 1.63 |
| LO | 09:58 | 72.09 | 72.15 | 0.08 |
| SGU | 09:36:14 | 7.72 | 7.97 | 3.24 |
- Incisive Stock Analysis
Finally, see our CANTATA evaluation for any of these, or any other stocks, by entering a symbol in the Stock Symbol Box. (Limited to 5 in any 24 hour period).
| Index | Value | Change Week | Change YTD | Trend | ||||||||||||||||||||||||||||||||||||
|---|---|---|---|---|---|---|---|---|---|---|---|---|---|---|---|---|---|---|---|---|---|---|---|---|---|---|---|---|---|---|---|---|---|---|---|---|---|---|---|---|
| Dow | 18272.6 | 0.45% | 2.52% | Up | ||||||||||||||||||||||||||||||||||||
| NASDAQ | 5048.29 | 0.89% | 6.59% | Up | ||||||||||||||||||||||||||||||||||||
| S&P 500 | 2122.73 | 0.31% | 3.1% | Up | ||||||||||||||||||||||||||||||||||||
1The Market Signal is derived
from our proprietary market model. The market model is
described on the site.
2The site also shows industry rankings based on fundamentals, combined technical and fundamentals, and on price alone. The site also shows daily industry movements. |
||||||||||||||||||||||||||||||||||||||||
|
Category
|
Symbol
|
Company Name
|
Expected Gain1
|
|---|---|---|---|
| Best Overall | PMFG | PMFG, Inc. | 113 |
| Top Technical | PMFG | PMFG, Inc. | 113 |
| Top Fundamental | GTN | Gray Television, Inc. | 68 |
| Top Tech. & Fund. | GTN | Gray Television, Inc. | 68 |
|
Category
|
Symbol
|
Company Name
|
Expected Gain1
|
|---|---|---|---|
| Best Overall | EMKR | EMCORE Corporation | 94 |
| Top Technical | EMKR | EMCORE Corporation | 94 |
| Top Fundamental | CRTO | Criteo S.A. | 43 |
| Top Tech. & Fund. | CRTO | Criteo S.A. | 43 |
If you received this newsletter from a friend and you would like to receive it regularly please go to the BreakoutWatch.com site and enter as a Guest. You will then be able to register to receive the newsletter.
Copyright © 2015 NBIcharts, LLC dba BreakoutWatch.com. All rights
reserved.
" BreakoutWatch," the BreakoutWatch.com "eye" logo, and the slogan
"tomorrow's breakouts today" are service marks of NBIcharts LLC.
All other marks are the property of their respective owners, and
are used for descriptive purposes only.
BreakoutWatch is not affiliated with Investor's Business Daily or
with Mr. William O'Neil. Our site, research and analysis is
supported entirely by subscription and is free from advertising.