| Market Summary | Weekly Breakout Report | Top Breakout Choices | Top 2nd Chances | New Features | Tip of the Week |
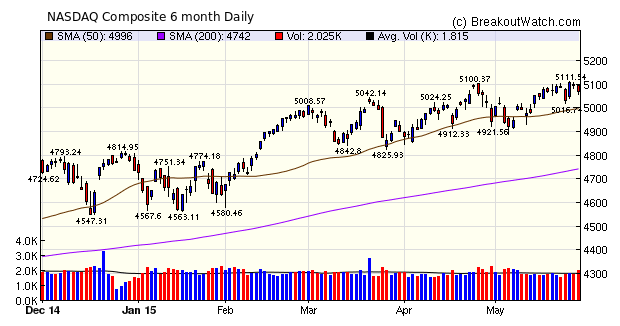
The NASDAQ Composite set another new high on Wednesday but disappointing economic data on Friday as 1st quarter GDP was revised down to -0.7% left the three major indexes with a loss for the week. The week started on Tuesday after the Memorial Day holiday with sharp decline as Greece's ability to make its next installment payment to the IMF came into doubt. This was resolved on Friday when Greece's Economy Minister said his country will be able to make its next debt payment. For an analysis of why this situation will not be resolved soon read John Nash's Game Theory and Greece.
Volatility Squeeze breakouts dominated this week with 17 out of 25 breakouts for an average gain of 3.97%. I analyze the SIMO chart below.
| Breakouts for Week Beginning 05/25/15 | |||||||||
| Brkout Date | Symbol | Base | Squeeze | BrkoutOut Price | Brkout Day Close | RS Rank* | Last Close | Current % off BOP | Gain at Intraday High |
|---|---|---|---|---|---|---|---|---|---|
| 05/27/15 | SIMO | SQZ | Y | 31.74 | 34.39 | 90 | 35.43 | 11.63 | 11.85 |
| 05/29/15 | FPRX | SQZ | Y | 23.54 | 25.75 | 93 | 25.75 | 9.39 | 9.43 |
| 05/27/15 | PTLA | SQZ | Y | 38.51 | 41.0304 | 88 | 41.95 | 8.93 | 9.3 |
| 05/27/15 | SNOW | CwH | N | 11.76 | 12.07 | 82 | 12.56 | 6.80 | 6.89 |
| 05/27/15 | INFN | SQZ | Y | 19.41 | 19.68 | 95 | 20.655 | 6.41 | 6.44 |
| 05/26/15 | TRVN | SQZ | Y | 6.77 | 6.77 | 92 | 7 | 3.40 | 6.2 |
| 05/28/15 | GLMD | SQZ | Y | 10.06 | 10.24 | 93 | 10.54 | 4.77 | 5.07 |
| 05/29/15 | HTBX | SQZ | Y | 6.59 | 6.89 | 82 | 6.89 | 4.55 | 4.55 |
| 05/27/15 | DXCM | SQZ | Y | 68.63 | 71.68 | 92 | 71.63 | 4.37 | 4.52 |
| 05/27/15 | BLUE | HTF | N | 186.36 | 189.93 | 99 | 194.45 | 4.34 | 4.36 |
| 05/27/15 | TNAV | CwH | Y | 9.40 | 9.75 | 90 | 9.04 | -3.83 | 3.94 |
| 05/26/15 | OPY | SQZ | Y | 25.10 | 25.4 | 84 | 25.91 | 3.23 | 3.9 |
| 05/26/15 | FEYE | SQZ | Y | 45.07 | 45.16 | 85 | 46.58 | 3.35 | 3.88 |
| 05/26/15 | SEMI | SQZ | Y | 23.61 | 23.61 | 91 | 24.21 | 2.54 | 3.2 |
| 05/27/15 | FBR | SQZ | Y | 13.84 | 14.24 | 87 | 13.825 | -0.11 | 2.96 |
| 05/29/15 | AMCN | HTF | N | 6.19 | 6.33 | 99 | 6.33 | 2.26 | 2.58 |
| 05/26/15 | LFC | SQZ | Y | 25.52** | 77.35 | 95 | 23.86 | -0.07 | 2.15 |
| 05/28/15 | UNTD | SQZ | Y | 17.06 | 17.37 | 89 | 17.27 | 1.23 | 1.82 |
| 05/29/15 | ATRC | SQZ | Y | 22.60 | 22.99 | 92 | 22.99 | 1.73 | 1.77 |
| 05/28/15 | SLAB | SQZ | Y | 54.70 | 54.9 | 82 | 55.66 | 1.76 | 1.76 |
| 05/28/15 | EMKR | CwH | N | 6.30 | 6.38 | 91 | 6.38 | 1.27 | 1.27 |
| 05/29/15 | VBLT | CwH | N | 8.06 | 8.13 | 96 | 8.13 | 0.87 | 1.12 |
| 05/28/15 | SPLK | CwH | N | 70.42 | 71.07 | 89 | 67.63 | -3.96 | 0.92 |
| 05/28/15 | LMNS | CwH | N | 12.15 | 12.25 | 85 | 12.25 | 0.82 | 0.82 |
| 05/29/15 | COO | SQZ | Y | 180.88 | 181.71 | 82 | 181.71 | 0.46 | 0.54 |
| Weekly Average (25 breakouts) | 3.05 | 4.05 | |||||||
|
*RS Rank on day
before breakout.
** adjusted for 3:1 split
|
|||||||||
No new features this week.
Recognizing A Volatility Squeeze
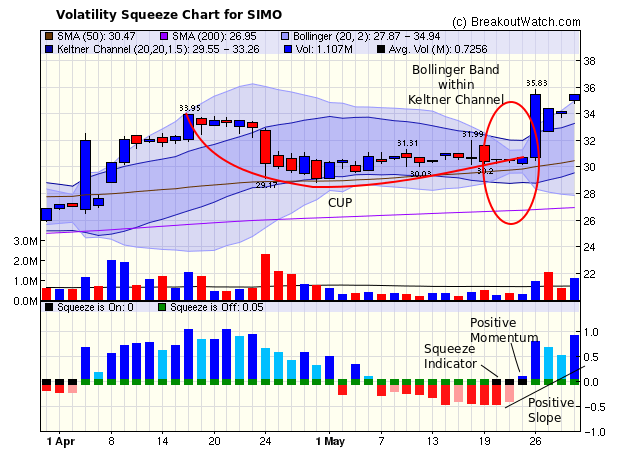
Our research has shown that breakouts from a cup and handle pattern are the most reliably profitable of the patterns we search for. We have also found that looking for stocks that are ascending the right side of a cup and that form a volatility squeeze is a reliable way to enter what could become a future cup and handle pattern (Volatility Squeeze Methoodology). This week's top breakout SIMO gives me an opportunity to explain again how this works.
We start by looking for stocks that are ascending the right side of a cup. We then examine their Bollinger Band and Keltner Channel characteristics to see if they are in a volatility squeeze situation. If they are, and their momentum is positive and momentum is increasing (meaning that there is a positive slope to the momentum curve) then we put them on a SqueezePlay (SQZ) watchlist.
Our cup recognition algorithm determined that SIMO was ascending the right side of a cup pattern as shown on the chart below. The algorithm detected a volatility squeeze for the first time on 5/20/15 and you can see clearly that the Bollinger Band was within the Keltner Channel from 5/20/15. We put SIMO on our Squeezeplay watchlist on 5/21 and a breakout attempt was made on 5/22 (we issued an alert at 9:45 at $30.55) but there was insufficient volume for it to be recognized as a full breakout. An alert was issued again on 5/27which was successful. If you had bought and held onto the first alert your gain at Friday's close would have been 16%.
Another interesting characteristic of this chart is that there is a shallow cup and handle pattern buried within it. The left cup is at 33.95 and a pivot and handle was formed at 31.99 on 5/18. However, at that point the cup was only 4 weeks long which was too short for cup and handle algorithm which requires a minimum cup length of 6 weeks.
| Index | Value | Change Week | Change YTD | Trend | ||||||||||||||||||||||||||||||||||||
|---|---|---|---|---|---|---|---|---|---|---|---|---|---|---|---|---|---|---|---|---|---|---|---|---|---|---|---|---|---|---|---|---|---|---|---|---|---|---|---|---|
| Dow | 18010.7 |
-1.21% | -1.05% | Up | ||||||||||||||||||||||||||||||||||||
| NASDAQ | 5070.0 | -0.38% | 7.05% | Up | ||||||||||||||||||||||||||||||||||||
| S&P 500 | 2107.4 | -0.88% | 2.36% | Up | ||||||||||||||||||||||||||||||||||||
1The Market Signal is derived
from our proprietary market model. The market model is
described on the site.
2The site also shows industry rankings based on fundamentals, combined technical and fundamentals, and on price alone. The site also shows daily industry movements. |
||||||||||||||||||||||||||||||||||||||||
|
Category
|
Symbol
|
Company Name
|
Expected Gain1
|
|---|---|---|---|
| Best Overall | PMFG | PMFG, Inc. | 110 |
| Top Technical | PMFG | PMFG, Inc. | 110 |
| Top Fundamental | MDXG | MiMedx Group, Inc | 73 |
| Top Tech. & Fund. | AAC | AAC Holdings, Inc. | 52 |
|
Category
|
Symbol
|
Company Name
|
Expected Gain1
|
|---|---|---|---|
| Best Overall | VBLT | Vascular Biogenics Ltd. | 100 |
| Top Technical | TNAV | TeleNav, Inc. | 69 |
| Top Fundamental | EMKR | EMCORE Corporation | 83 |
| Top Tech. & Fund. | EMKR | EMCORE Corporation | 83 |
If you received this newsletter from a friend and you would like to receive it regularly please go to the BreakoutWatch.com site and enter as a Guest. You will then be able to register to receive the newsletter.
Copyright © 2015 NBIcharts, LLC dba BreakoutWatch.com. All rights
reserved.
" BreakoutWatch," the BreakoutWatch.com "eye" logo, and the slogan
"tomorrow's breakouts today" are service marks of NBIcharts LLC.
All other marks are the property of their respective owners, and
are used for descriptive purposes only.
BreakoutWatch is not affiliated with Investor's Business Daily or
with Mr. William O'Neil. Our site, research and analysis is
supported entirely by subscription and is free from advertising.