| Market Summary | Weekly Breakout Report | Top Breakout Choices | Top 2nd Chances | New Features | Tip of the Week |
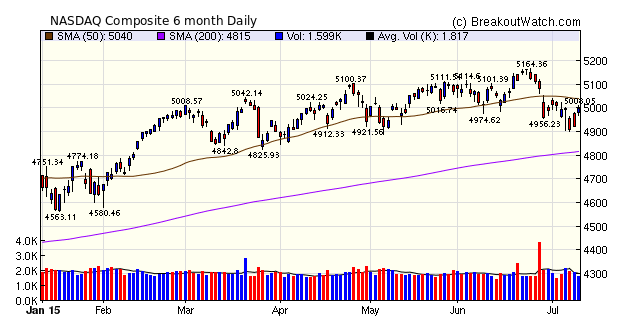
There was no newsletter last week due to the July 4 holiday. Since our last report the NASDAQ composite has fallen below its 50 day average and our trend indicators are now negative for all three major indexes. However, the NASDAQ has risen in the last three days and the 50 day average now forms a resistance level. Whether or not that level gets tested depends in part on the German response to the latest reform proposals from Greece. At the time of writing, it appears that the Germans are holding out for even more austerity which will only result in a further fall in Greece's GDP and reduce further their ability to repay their debt.
Although market conditions were not ideal, there were still a healthy number of breakouts this week, only 4 of which had lost value at Friday's close.
| Breakouts for Week Beginning 07/06/15 | |||||||||
| Brkout Date | Symbol | Base | Squeeze | BrkoutOut Price | Brkout Day Close | RS Rank* | Last Close | Current % off BOP | Gain at Intraday High |
|---|---|---|---|---|---|---|---|---|---|
| 07/10/15 | CHRS | SQZ | Y | 29.88 | 33.06 | 86 | 33.06 | 10.64 | 10.64 |
| 07/09/15 | DVAX | CwH | N | 25.51 | 26.44 | 99 | 28.11 | 10.19 | 10.19 |
| 07/06/15 | FPRX | SQZ | Y | 23.80 | 24.92 | 93 | 26.01 | 9.29 | 9.29 |
| 07/10/15 | ZGNX | HTF | N | 13.96 | 15.17 | 99 | 15.17 | 8.67 | 8.67 |
| 07/06/15 | CNTY | SQZ | Y | 6.49 | 7.03 | 88 | 6.5 | 0.15 | 8.32 |
| 07/10/15 | ERI | SQZ | Y | 8.32 | 8.95 | 97 | 8.95 | 7.57 | 7.57 |
| 07/07/15 | FLXN | SQZ | Y | 22.36 | 23.29 | 87 | 23.74 | 6.17 | 6.17 |
| 07/06/15 | UVE | SQZ | Y | 25.23 | 25.88 | 95 | 26.73 | 5.95 | 5.95 |
| 07/07/15 | TYL | CwH | N | 131.14 | 133.48 | 88 | 138.42 | 5.55 | 5.55 |
| 07/09/15 | NGHC | CwH | N | 21.36 | 21.42 | 83 | 22.27 | 4.26 | 4.26 |
| 07/07/15 | FPRX | SQZ | Y | 24.95 | 25.89 | 95 | 26.01 | 4.25 | 4.25 |
| 07/07/15 | ULTA | SQZ | Y | 157.23 | 159.42 | 90 | 163.11 | 3.74 | 3.74 |
| 07/10/15 | TREC | CwH | N | 15.48 | 16.05 | 91 | 16.05 | 3.68 | 3.68 |
| 07/10/15 | CARA | CwH | N | 12.82 | 13.28 | 89 | 13.28 | 3.59 | 3.59 |
| 07/07/15 | INN | SQZ | Y | 13.73 | 13.99 | 82 | 14.19 | 3.35 | 3.35 |
| 07/09/15 | GWRE | CwH | N | 54.64 | 56.29 | 84 | 56.24 | 2.93 | 3.02 |
| 07/06/15 | FNF | SQZ | Y | 37.65 | 38.14 | 83 | 38.76 | 2.95 | 2.95 |
| 07/07/15 | BR | SQZ | Y | 52.07 | 52.43 | 80 | 53.57 | 2.88 | 2.88 |
| 07/09/15 | ULTA | SQZ | Y | 158.57 | 159.91 | 92 | 163.11 | 2.86 | 2.86 |
| 07/10/15 | FAF | CwH | N | 38.47 | 39.53 | 89 | 39.53 | 2.76 | 2.76 |
| 07/07/15 | MBLY | CwH | N | 55.84 | 55.91 | 91 | 57.35 | 2.70 | 2.7 |
| 07/07/15 | DPS | DB | Y | 75.36 | 77.34 | 74 | 77.18 | 2.42 | 2.63 |
| 07/10/15 | SABR | SQZ | Y | 25.04 | 25.65 | 87 | 25.65 | 2.44 | 2.44 |
| 07/07/15 | MNK | SQZ | Y | 119.60 | 121.2 | 86 | 122.44 | 2.37 | 2.37 |
| 07/07/15 | WST | CwH | N | 59.46 | 60.65 | 84 | 59.92 | 0.77 | 2 |
| 07/07/15 | SUI | SQZ | Y | 64.85 | 65.66 | 80 | 66.1 | 1.93 | 1.93 |
| 07/06/15 | NSP | SQZ | Y | 51.51 | 52.2 | 94 | 52.47 | 1.86 | 1.86 |
| 07/06/15 | QNST | CwH | N | 6.66 | 6.78 | 84 | 6.56 | -1.50 | 1.8 |
| 07/09/15 | GNCMA | CwH | N | 17.53 | 17.61 | 91 | 17.83 | 1.71 | 1.71 |
| 07/06/15 | INAP | SQZ | Y | 9.34 | 9.46 | 81 | 9.5 | 1.71 | 1.71 |
| 07/07/15 | LEN | CwH | N | 52.50 | 52.77 | 82 | 53.3 | 1.52 | 1.52 |
| 07/07/15 | MDCO | SQZ | Y | 32.82 | 33.3 | 90 | 32.73 | -0.27 | 1.46 |
| 07/10/15 | ABCO | SQZ | Y | 57.21 | 57.96 | 82 | 57.96 | 1.31 | 1.31 |
| 07/10/15 | BR | SQZ | Y | 52.93 | 53.57 | 83 | 53.57 | 1.21 | 1.21 |
| 07/10/15 | BSAC | HSB | N | 20.24 | 20.48 | 30 | 20.48 | 1.19 | 1.19 |
| 07/07/15 | WNR | SQZ | Y | 46.01 | 46.29 | 82 | 46.54 | 1.15 | 1.15 |
| 07/09/15 | IMKTA | SQZ | Y | 50.46 | 50.95 | 95 | 50.78 | 0.63 | 0.97 |
| 07/07/15 | MD | CwH | N | 75.63 | 76.29 | 86 | 76.01 | 0.50 | 0.87 |
| 07/09/15 | PZN | CwH | N | 11.25 | 11.34 | 87 | 11.33 | 0.71 | 0.8 |
| 07/07/15 | PLCE | SQZ | Y | 65.86 | 66.3 | 86 | 64.61 | -1.90 | 0.67 |
| 07/10/15 | HAWK | CwH | N | 42.39 | 42.61 | 90 | 42.61 | 0.52 | 0.52 |
| 07/07/15 | INAP | SQZ | Y | 9.46 | 9.48 | 82 | 9.5 | 0.42 | 0.42 |
| 07/06/15 | ENH | CwH | N | 66.93 | 67.01 | 83 | 67.07 | 0.21 | 0.31 |
| 07/06/15 | ADVS | CwH | N | 44.24 | 44.25 | 90 | 67.07 | N/A | 0.02 |
| 07/06/15 | CYTK | SQZ | Y | 6.35 | 6.35 | 83 | 6.1 | -3.94 | -0 |
| Weekly Average (45 breakouts) | 2.69 | 3.18 | |||||||
| *RS Rank on day before breakout. | |||||||||
A download tab was added to each watchlist at a user's request. Clicking this tab will download the watchlists in .csv format suitable for import into any spreadsheet package such as Excel.

Two Potential Breakouts for this Week
I am not recommending you buy these stocks but they may be worth watching.
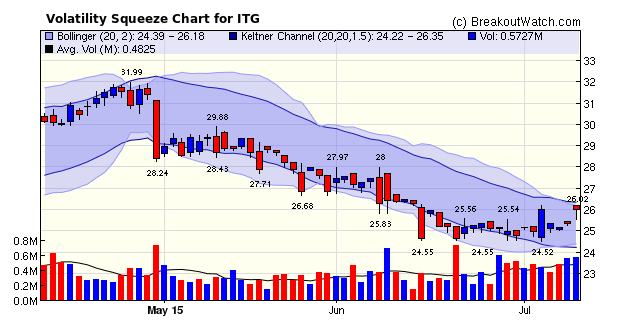
Our volatility squeeze watchlist looks for stocks that have fallen but are now ascending the right side of a cup and may have stalled in their ascent creating a volatility squeeze. We recognize a volatility squeeze when the Bollinger Bands lie within the Keltner Channel. These situations present a buying opportunity when their upward movement resumes.
Investment Technology Group, Inc. (ITG) is an independent execution and research broker that partners with global portfolio managers and traders. ITG is starting to ascend the right side of a cup and in the process has formed a volatility squeeze situation. Heavy buying on Monday was resumed in the last two days with positive price movement and volume that was well above average. This indicates that ITG may move higher next week, overall market conditions permitting. We attribute a relative strength rank of 90 to ITG placing its 12 month price performance in the top 90% of the 6000+ stocks we follow.
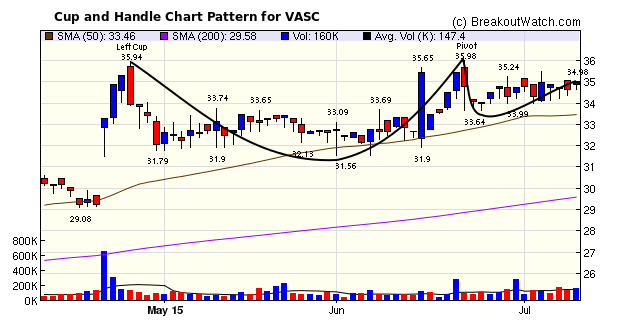
Our Cup and Handle Watchlist finds stocks that are in a cup and handle chart pattern.
Vascular Solutions, Inc. (VASC) is a medical device company which creates minimally invasive medical devices. Since setting a pivot price of 35.98 on 6/22/15 the handle has shown an upward trend despite generally unfavorable market conditions. On Friday the stock closed higher on above average volume. Although a breakout may be a few days away, it is worth following in the short term. We attribute a relative strength rank of 91 to VASC placing its 12 month price performance in the top 91% of the 6000+ stocks we follow.
| Index | Value | Change Week | Change YTD | Trend | ||||||||||||||||||||||||||||||||||||
|---|---|---|---|---|---|---|---|---|---|---|---|---|---|---|---|---|---|---|---|---|---|---|---|---|---|---|---|---|---|---|---|---|---|---|---|---|---|---|---|---|
| Dow | 17760.4 | -0.35% | -0.17% | Down | ||||||||||||||||||||||||||||||||||||
| NASDAQ | 4997.7 | -0.23% | 5.52% |
Down | ||||||||||||||||||||||||||||||||||||
| S&P 500 | 2076.62 | -0.01% | 0.86% | Down | ||||||||||||||||||||||||||||||||||||
1The Market Signal is derived
from our proprietary market model. The market model is
described on the site.
2The site also shows industry rankings based on fundamentals, combined technical and fundamentals, and on price alone. The site also shows daily industry movements. |
||||||||||||||||||||||||||||||||||||||||
|
Category
|
Symbol
|
Company Name
|
Expected Gain1
|
|---|---|---|---|
| Best Overall | GLUU | Glu Mobile Inc. | 105 |
| Top Technical | GLUU | Glu Mobile Inc. | 105 |
| Top Fundamental | MDXG | MiMedx Group, Inc | 69 |
| Top Tech. & Fund. | MDXG | MiMedx Group, Inc | 69 |
|
Category
|
Symbol
|
Company Name
|
Expected Gain1
|
|---|---|---|---|
| Best Overall | QNST | QuinStreet, Inc. | 101 |
| Top Technical | TREC | Trecora Resources | 57 |
| Top Fundamental | NGHC | National General Holdings Corp | 44 |
| Top Tech. & Fund. | NGHC | National General Holdings Corp | 44 |
If you received this newsletter from a friend and you would like to receive it regularly please go to the BreakoutWatch.com site and enter as a Guest. You will then be able to register to receive the newsletter.
Copyright © 2015 NBIcharts, LLC dba BreakoutWatch.com. All rights
reserved.
" BreakoutWatch," the BreakoutWatch.com "eye" logo, and the slogan
"tomorrow's breakouts today" are service marks of NBIcharts LLC.
All other marks are the property of their respective owners, and
are used for descriptive purposes only.
BreakoutWatch is not affiliated with Investor's Business Daily or
with Mr. William O'Neil. Our site, research and analysis is
supported entirely by subscription and is free from advertising.