| Market Summary | Weekly Breakout Report | Top Breakout Choices | Top 2nd Chances | New Features | Tip of the Week |
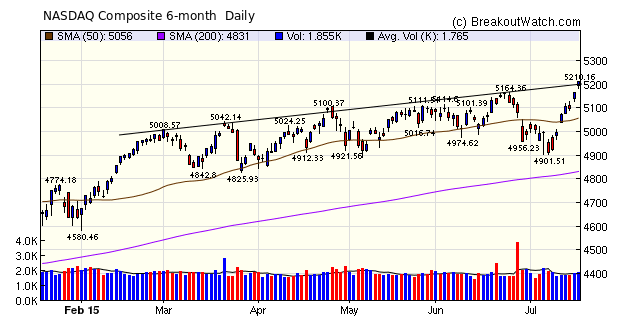
On Monday the markets reacted favorably to prospects of another Greek bailout and the NASDAQ Composite has been on a tear since then with a gain of 4.25% for the week. The week started with a gap up above resistance at the 50 day average level and closed at a new high directly in line with the trend line corresponding to the highs of the last 6 months. We see from the chart below that each new high was followed by a pull back so on that basis we should expect a consolidation in the days ahead rather than a continuation of new highs.
Our market trend signals for all three indexes turned upward on Thursday.
This was an exceptionally strong week for breakouts with 59 coming from our Cup and Handle and Volatility Squeeze watchlists. The average gain by Friday's close was 4.28% above the breakout price.
| Breakouts for Week Beginning 07/13/15 | |||||||||
| Brkout Date | Symbol | Base | Squeeze | BrkoutOut Price | Brkout Day Close | RS Rank* | Last Close | Current % off BOP | Gain at Intraday High |
|---|---|---|---|---|---|---|---|---|---|
| 07/13/15 | NEOT | CwH | N | 9.98 | 10.73 | 90 | 12.3875 | 24.12 | 32.77 |
| 07/14/15 | CEMP | SQZ | Y | 36.20 | 38.25 | 98 | 42.1 | 16.30 | 16.33 |
| 07/13/15 | NLNK | SQZ | Y | 46.96 | 49.97 | 95 | 54.43 | 15.91 | 15.91 |
| 07/14/15 | CARA | CwH | N | 13.63 | 13.73 | 90 | 15.65 | 14.82 | 14.97 |
| 07/13/15 | GTN | SQZ | Y | 15.79 | 16.55 | 95 | 17.61 | 11.53 | 11.59 |
| 07/15/15 | RCPT | SQZ | Y | 207.04 | 230.08 | 99 | 229.64 | 10.92 | 11.13 |
| 07/15/15 | TSRO | SQZ | Y | 59.95 | 61.73 | 96 | 65.74 | 9.66 | 9.84 |
| 07/13/15 | MDXG | CwH | N | 11.93 | 12.11 | 93 | 13 | 8.97 | 8.97 |
| 07/14/15 | NLNK | SQZ | Y | 50.02 | 52.19 | 93 | 54.43 | 8.82 | 8.82 |
| 07/15/15 | XON | CwH | Y | 51.44 | 53.80 | 97 | 55.81 | 8.50 | 8.67 |
| 07/14/15 | TITN | SQZ | Y | 15.38 | 15.38 | 80 | 16.13 | 4.88 | 8.32 |
| 07/13/15 | FLXN | SQZ | Y | 23.82 | 24.28 | 91 | 25.6 | 7.47 | 8.31 |
| 07/13/15 | AMZN | CwH | N | 447.04 | 455.57 | 92 | 483.55 | 8.17 | 8.18 |
| 07/15/15 | ESPR | SQZ | Y | 91.95 | 96.68 | 99 | 98.945 | 7.61 | 7.78 |
| 07/13/15 | MRTX | SQZ | Y | 31.61 | 33.63 | 95 | 32.99 | 4.37 | 7.09 |
| 07/16/15 | TSRO | SQZ | Y | 61.57 | 64.73 | 97 | 65.74 | 6.77 | 6.95 |
| 07/14/15 | GTN | SQZ | Y | 16.55 | 17.03 | 95 | 17.61 | 6.40 | 6.47 |
| 07/13/15 | CLFD | SQZ | Y | 16.25 | 16.89 | 85 | 16.45 | 1.23 | 6.4 |
| 07/14/15 | AMZN | SQZ | Y | 455.78 | 465.57 | 93 | 483.55 | 6.09 | 6.11 |
| 07/13/15 | ANIP | CwH | N | 65.46 | 67.19 | 95 | 69.46 | 6.11 | 6.11 |
| 07/13/15 | BKS | CwH | N | 27.10 | 27.98 | 88 | 28.68 | 5.83 | 5.83 |
| 07/13/15 | HQH | CwH | N | 36.81 | 37.74 | 84 | 38.86 | 5.57 | 5.57 |
| 07/14/15 | FLXN | CwH | N | 24.47 | 25.05 | 91 | 25.6 | 4.62 | 5.44 |
| 07/17/15 | ABMD | SQZ | Y | 68.87 | 72.4 | 98 | 72.4 | 5.13 | 5.24 |
| 07/16/15 | EDN | SQZ | Y | 14.31 | 15.03 | 81 | 15 | 4.82 | 5.03 |
| 07/14/15 | EBAY | SQZ | Y | 63.48 | 63.59 | 85 | 66.39 | 4.58 | 4.84 |
| 07/16/15 | LEAF | SQZ | Y | 48.43 | 50.73 | 92 | 50.185 | 3.62 | 4.75 |
| 07/14/15 | INCY | SQZ | Y | 112.98 | 117.46 | 97 | 117.025 | 3.58 | 4.17 |
| 07/14/15 | LION | CwH | N | 17.74 | 17.79 | 83 | 18.415 | 3.80 | 3.95 |
| 07/13/15 | WNR | SQZ | Y | 46.63 | 47.27 | 80 | 48.39 | 3.77 | 3.8 |
| 07/15/15 | ALKS | SQZ | Y | 67.36 | 68.56 | 87 | 69.8 | 3.62 | 3.67 |
| 07/13/15 | NEWT | SQZ | Y | 18.18 | 18.46 | 99 | 18.81 | 3.47 | 3.47 |
| 07/16/15 | RH | CwH | N | 100.80 | 103.73 | 80 | 104.2 | 3.37 | 3.38 |
| 07/15/15 | MSTR | SQZ | Y | 180.92 | 182.87 | 80 | 185.97 | 2.79 | 2.97 |
| 07/13/15 | ACN | SQZ | Y | 98.87 | 100.55 | 81 | 100.43 | 1.58 | 2.61 |
| 07/16/15 | PBE | CwH | N | 61.25 | 62.32 | 86 | 62.77 | 2.48 | 2.48 |
| 07/13/15 | HFC | CwH | N | 45.36 | 45.69 | 83 | 46.43 | 2.36 | 2.38 |
| 07/13/15 | DENN | SQZ | Y | 11.85 | 12.09 | 92 | 11.73 | -1.01 | 2.03 |
| 07/15/15 | MDCO | CwH | N | 33.77 | 33.82 | 91 | 34.25 | 1.42 | 1.92 |
| 07/16/15 | EXLS | CwH | N | 36.65 | 36.90 | 85 | 37.25 | 1.64 | 1.8 |
| 07/13/15 | THC | CwH | N | 59.80 | 59.91 | 85 | 58.74 | -1.77 | 1.64 |
| 07/16/15 | ZIOP | CwH | N | 12.81 | 13.02 | 98 | 12.925 | 0.90 | 1.64 |
| 07/13/15 | PLKI | SQZ | Y | 60.67 | 61.64 | 86 | 59.745 | -1.52 | 1.6 |
| 07/13/15 | IHE | CwH | N | 181.28 | 182.43 | 83 | 184.02 | 1.51 | 1.59 |
| 07/17/15 | WNS | SQZ | Y | 28.61 | 28.96 | 90 | 28.96 | 1.22 | 1.4 |
| 07/17/15 | ATTU | SQZ | Y | 13.81 | 13.89 | 96 | 13.89 | 0.58 | 1.09 |
| 07/14/15 | IHE | SQZ | Y | 182.39 | 183.81 | 85 | 184.02 | 0.89 | 0.98 |
| 07/16/15 | FV | CwH | N | 25.27 | 25.37 | 81 | 25.49 | 0.87 | 0.95 |
| 07/17/15 | CLDX | SQZ | Y | 26.62 | 26.81 | 93 | 26.81 | 0.71 | 0.75 |
| 07/17/15 | EXPE | SQZ | Y | 110.01 | 110.78 | 90 | 110.78 | 0.70 | 0.72 |
| 07/16/15 | WDFC | CwH | Y | 88.83 | 89.46 | 80 | 89.36 | 0.60 | 0.71 |
| 07/15/15 | AVY | SQZ | Y | 63.08 | 63.52 | 89 | 61.75 | -2.11 | 0.7 |
| 07/14/15 | ATVI | SQZ | Y | 25.88 | 26.06 | 88 | 25.795 | -0.33 | 0.7 |
| 07/14/15 | NORD | SQZ | Y | 25.17 | 25.34 | 89 | 24.51 | -2.62 | 0.68 |
| 07/14/15 | CHDN | SQZ | Y | 129.90 | 129.98 | 91 | 129.65 | -0.19 | 0.63 |
| 07/15/15 | MNK | SQZ | Y | 124.01 | 124.63 | 88 | 123.11 | -0.73 | 0.5 |
| 07/16/15 | PZN | CwH | N | 11.73 | 11.77 | 89 | 11.68 | -0.43 | 0.34 |
| 07/15/15 | WIX | CwH | Y | 25.82 | 25.85 | 91 | 25.59 | -0.89 | 0.12 |
| 07/14/15 | PSX | SQZ | Y | 83.46 | 83.52 | 81 | 83.18 | -0.34 | 0.07 |
| Weekly Average (59 breakouts) | 4.28 | 5.13 | |||||||
| *RS Rank on day before breakout. | |||||||||
No new features this week
New Model for Cup and Handle Watchlist Stocks
Not so much a "Top Tip" this week as a report on what appears to be a promising new algorithm for predicting Cup and Handle pattern stocks that will close higher at the next session.
Readers will know that over the last few weeks I have been emphasizing the importance of positive price and volume moves as an indicator of a possible pending breakout, so I decided to incorporate those findings into a new model to predict Cup and Handle watchlist stocks that would close higher.
Using data from 2014 to date. I created a variable for close up and close down on the day after appearance on the CwH watchlist. I then created models using a statistical technique called Discriminant Analysis to predict the price movement as up or down on the day after appearance on the watchlist. I also used a technique known as "bootstrapping" which samples subsets of the data to build a model that is the best fit over all samples.
Also, I know that the most important criterion for breakout performance is our Relative Strength rank (RS) so I built the models for different levels of RS starting from >= 80 up to >=95. I was looking for an RS level that would give me a predicted to actual ratio that would be acceptable for trading. At the >= 95 level I found that the model's success ratio was 68.5%. The results are shown in this table. The successful prediction numbers are highlighted in yellow. When summing these and dividing by the total number of cases we get a success ratio of 68.5%
| CwH watchlist
entries where RS >= 95 |
Predicted | Total | |
|---|---|---|---|
| Actual | Down | Up | |
| Closed Down | 3780 | 1714 | 5494 |
| Closed Up | 165 | 298 | 463 |
| 5957 | |||
| Predicted % success = (3780 + 298)/5957 = 68.5% | |||
When applying the model to all data since 2008, I found that the success rate was 68.4%. This shows that the model is robust over boom and bust market cycles.
Conclusion
The implications of this, are that if we place an order to buy at a limit price of the nightly close where the prediction is that the stock will close up, then we will make an immediate profit at least 6 times out of 10.
Over the next week I intend to further refine the model, implement the model predictions on the CwH watchlist and recommend an appropriate trading strategy.
| Index | Value | Change Week | Change YTD | Trend | ||||||||||||||||||||||||||||||||||||
|---|---|---|---|---|---|---|---|---|---|---|---|---|---|---|---|---|---|---|---|---|---|---|---|---|---|---|---|---|---|---|---|---|---|---|---|---|---|---|---|---|
| Dow | 18086.4 | 1.84% | 1.48% | Up | ||||||||||||||||||||||||||||||||||||
| NASDAQ | 5210.14 | 4.25% | 10.01% | Up | ||||||||||||||||||||||||||||||||||||
| S&P 500 | 2126.64 | 2.41% | 3.29% | Up | ||||||||||||||||||||||||||||||||||||
1The Market Signal is derived
from our proprietary market model. The market model is
described on the site.
2The site also shows industry rankings based on fundamentals, combined technical and fundamentals, and on price alone. The site also shows daily industry movements. |
||||||||||||||||||||||||||||||||||||||||
|
Category
|
Symbol
|
Company Name
|
Expected Gain1
|
|---|---|---|---|
| Best Overall | GLUU | Glu Mobile Inc. | 115 |
| Top Technical | GLUU | Glu Mobile Inc. | 115 |
| Top Fundamental | ANET | Arista Networks, Inc. | 37 |
| Top Tech. & Fund. | ANET | Arista Networks, Inc. | 37 |
|
Category
|
Symbol
|
Company Name
|
Expected Gain1
|
|---|---|---|---|
| Best Overall | ZIOP | ZIOPHARM Oncology Inc | 80 |
| Top Technical | IHE | iShares Dow Jones US Pharm Indx (ETF) | 0 |
| Top Fundamental | RH | Restoration Hardware Holdings Inc. | 27 |
| Top Tech. & Fund. | RH | Restoration Hardware Holdings Inc. | 27 |
If you received this newsletter from a friend and you would like to receive it regularly please go to the BreakoutWatch.com site and enter as a Guest. You will then be able to register to receive the newsletter.
Copyright © 2015 NBIcharts, LLC dba BreakoutWatch.com. All rights
reserved.
" BreakoutWatch," the BreakoutWatch.com "eye" logo, and the slogan
"tomorrow's breakouts today" are service marks of NBIcharts LLC.
All other marks are the property of their respective owners, and
are used for descriptive purposes only.
BreakoutWatch is not affiliated with Investor's Business Daily or
with Mr. William O'Neil. Our site, research and analysis is
supported entirely by subscription and is free from advertising.