| Market Summary | Weekly Breakout Report | Top Breakout Choices | Top 2nd Chances | New Features | Tip of the Week |
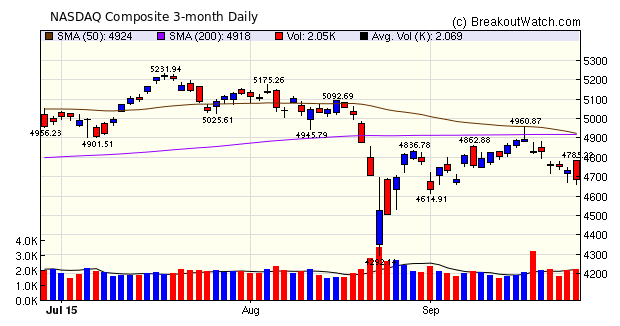
The NASDAQ Composite fell 3% this week, mostly due to weakness in biotechnology following Hillary Clinton's threat to take on price-gouging following the outrageous 4,000% price increase in 62-year old drug Daraprim. The NASDAQ's Biotechnology Index fell about 14% this week.
The 50 day moving average is now on track to fall below the 200 dma in the next day or so. This is a bearish sign that we haven't seen since mid-2011. The index is now officially in a correction, having fallen 10.7% from its July 20 high.
Breakouts from our Volatility Squeeze watchlists continued to dominate this week with 23 out of 33 breakouts.
| Breakouts for Week Beginning 09/21/15 | |||||||||
| Brkout Date | Symbol | Base | Squeeze | BrkoutOut Price | Brkout Day Close | RS Rank* | Last Close | Current % off BOP | Gain at Intraday High |
|---|---|---|---|---|---|---|---|---|---|
| 09/23/15 | ZOES | SQZ | Y | 35.66 | 37.04 | 85 | 37.26 | 4.49 | 11.3 |
| 09/24/15 | DGII | CwH | N | 10.84 | 11.01 | 91 | 11.82 | 9.04 | 9.04 |
| 09/21/15 | EBF | SQZ | Y | 16.46 | 17.34 | 89 | 17.4 | 5.71 | 8.02 |
| 09/23/15 | TSO | SQZ | Y | 94.54 | 99.07 | 94 | 101.53 | 7.39 | 7.39 |
| 09/21/15 | RLH | SQZ | Y | 8.31 | 8.35 | 94 | 8.83 | 6.26 | 6.26 |
| 09/22/15 | SHEN | SQZ | Y | 41.44 | 41.92 | 96 | 42.97 | 3.69 | 5.57 |
| 09/23/15 | LOGM | SQZ | Y | 64.20 | 67.53 | 90 | 65.97 | 2.76 | 5.3 |
| 09/25/15 | MB | CwH | N | 16.10 | 16.76 | 90 | 16.76 | 4.10 | 4.1 |
| 09/24/15 | MHO | SQZ | Y | 24.48 | 24.72 | 82 | 25.46 | 4.00 | 4 |
| 09/24/15 | IBCP | SQZ | Y | 14.16 | 14.69 | 86 | 14.61 | 3.18 | 3.81 |
| 09/24/15 | PFSW | CwH | N | 13.76 | 14.06 | 88 | 14.24 | 3.49 | 3.49 |
| 09/21/15 | XXIA | SQZ | Y | 15.16 | 15.45 | 95 | 14.84 | -2.11 | 2.24 |
| 09/24/15 | WST | SQZ | Y | 56.68 | 57.9 | 80 | 55.66 | -1.80 | 2.22 |
| 09/21/15 | MTN | SQZ | Y | 105.87 | 108.13 | 85 | 107.42 | 1.46 | 2.13 |
| 09/24/15 | AGII | SQZ | Y | 55.65 | 56.74 | 85 | 56.63 | 1.76 | 1.99 |
| 09/21/15 | STC | SQZ | Y | 38.96 | 39.46 | 83 | 39.46 | 1.28 | 1.95 |
| 09/24/15 | EFSC | SQZ | Y | 24.51 | 24.95 | 93 | 24.76 | 1.02 | 1.84 |
| 09/24/15 | INDB | SQZ | Y | 45.34 | 45.4 | 81 | 46.16 | 1.81 | 1.81 |
| 09/25/15 | WDFC | CwH | N | 88.77 | 90.33 | 85 | 90.33 | 1.76 | 1.76 |
| 09/21/15 | TXMD | CwH | N | 7.33 | 7.45 | 92 | 6.33 | -13.64 | 1.64 |
| 09/21/15 | DOX | SQZ | Y | 57.56 | 58.44 | 88 | 57.36 | -0.35 | 1.53 |
| 09/25/15 | EGBN | CwH | N | 44.65 | 45.28 | 91 | 45.28 | 1.41 | 1.41 |
| 09/25/15 | PFSW | SQZ | Y | 14.07 | 14.24 | 91 | 14.24 | 1.21 | 1.21 |
| 09/24/15 | QADA | SQZ | Y | 26.32 | 26.51 | 89 | 26.13 | -0.72 | 1.14 |
| 09/24/15 | HTBI | SQZ | Y | 18.38 | 18.57 | 90 | 18.43 | 0.27 | 1.03 |
| 09/24/15 | WHF | CwH | N | 13.32 | 13.37 | 85 | 13.43 | 0.83 | 0.83 |
| 09/24/15 | BONA | SQZ | Y | 11.91 | 11.99 | 97 | 11.97 | 0.50 | 0.76 |
| 09/24/15 | MEOH | HSB | N | 34.75 | 34.91 | 11 | 34.8 | 0.14 | 0.55 |
| 09/24/15 | BNCN | CwH | N | 22.17 | 22.25 | 94 | 22.25 | 0.36 | 0.36 |
| 09/24/15 | TBNK | SQZ | Y | 26.16 | 26.25 | 92 | 25.95 | -0.80 | 0.34 |
| 09/25/15 | DBL | CwH | N | 24.70 | 24.75 | 84 | 24.75 | 0.20 | 0.2 |
| 09/23/15 | KYTH | SQZ | Y | 74.90 | 74.93 | 98 | 74.93 | 0.04 | 0.09 |
| 09/24/15 | KYTH | SQZ | Y | 74.94 | 74.95 | 98 | 74.93 | -0.01 | 0.04 |
| Weekly Average (33 breakouts) | 1.48 | 2.89 | |||||||
| *RS Rank on day before breakout. | |||||||||
No new features this week.
How to Recognize EPS Trends and Find Next Reporting Date
One of the columns that you can filter for on our watchlists is Estimated EPS. This is the current analysts consensus estimate for earnings per share (EPS) to be announced at the company's next reporting date. While this number is important, as share price is often a function of forward earnings estimates, it is also desirable to know if the estimate is increasing or decreasing.
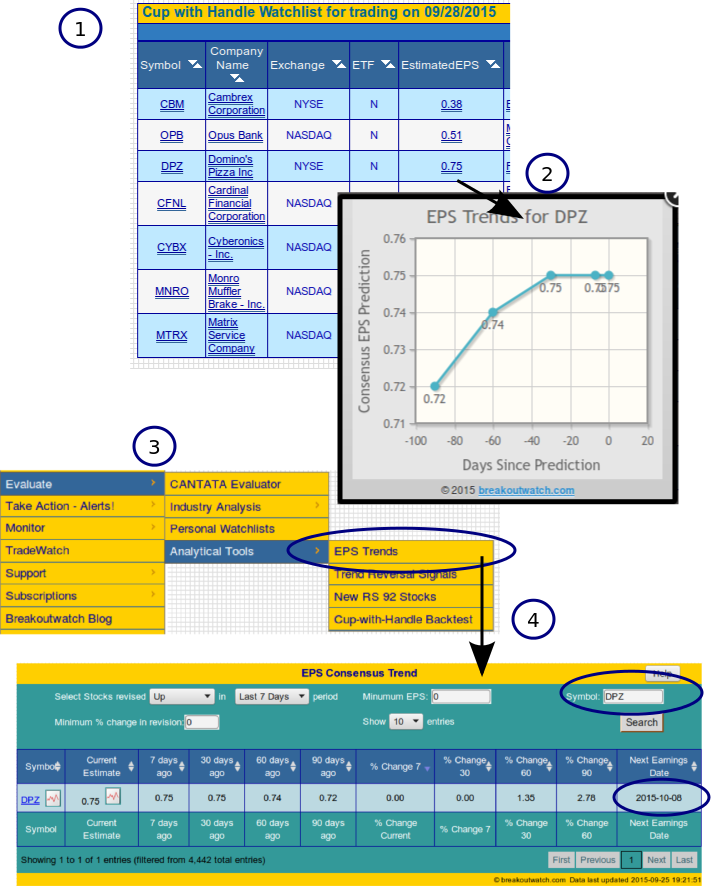
Shown below (1) is a snapshot of our cup and handle watchlist for trading next Monday filtered for stocks that had above average volume on Friday. The stock with the highest estimated EPS was DPZ (Domino's Pizza). Clicking on the EPS number, 0.75, will bring up a chart (2) showing how this estimated EPS has changed over the last 90, 60, 30, 7 days as well as the latest estimate.
In this case we see that the EPS Estimate has been increasing. Now, we would expect that the closer we get to the next reporting date, then the more accurate will the estimate be, so we will also want to know when that date is.
To find the next reporting date, we go to our Analytical Tools > EPS Trends menu choice (3).
This will bring up a table of all stocks for which we have EPS Trend data. By entering DPZ in the search box, we obtain a table showing the historical EPS Estimates and the next reporting date in the final column (4).
| Index | Value | Change Week | Change YTD | Trend | ||||||||||||||||||||||||||||||||||||
|---|---|---|---|---|---|---|---|---|---|---|---|---|---|---|---|---|---|---|---|---|---|---|---|---|---|---|---|---|---|---|---|---|---|---|---|---|---|---|---|---|
| Dow | 16314.7 | -0.43% | -8.46% | Down | ||||||||||||||||||||||||||||||||||||
| NASDAQ | 4686.5 | -2.92% | -1.05% | Down | ||||||||||||||||||||||||||||||||||||
| S&P 500 | 1931.34 | -1.36% | -6.2% | Down | ||||||||||||||||||||||||||||||||||||
1The Market Signal is derived
from our proprietary market model. The market model is
described on the site.
2The site also shows industry rankings based on fundamentals, combined technical and fundamentals, and on price alone. The site also shows daily industry movements. |
||||||||||||||||||||||||||||||||||||||||
|
Category
|
Symbol
|
Company Name
|
Expected Gain1
|
|---|---|---|---|
| Best Overall | TNK | Teekay Tankers Ltd. | 109 |
| Top Technical | TNK | Teekay Tankers Ltd. | 109 |
| Top Fundamental | CMN | Cantel Medical Corp. | 52 |
| Top Tech. & Fund. | LMAT | LeMaitre Vascular, Inc. | 56 |
|
Category
|
Symbol
|
Company Name
|
Expected Gain1
|
|---|---|---|---|
| Best Overall | MB | MINDBODY, Inc. | 71 |
| Top Technical | MB | MINDBODY, Inc. | 71 |
| Top Fundamental | BNCN | BNC Bancorp | 47 |
| Top Tech. & Fund. | BNCN | BNC Bancorp | 47 |
If you received this newsletter from a friend and you would like to receive it regularly please go to the BreakoutWatch.com site and enter as a Guest. You will then be able to register to receive the newsletter.
Copyright © 2015 NBIcharts, LLC dba BreakoutWatch.com. All rights
reserved.
" BreakoutWatch," the BreakoutWatch.com "eye" logo, and the slogan
"tomorrow's breakouts today" are service marks of NBIcharts LLC.
All other marks are the property of their respective owners, and
are used for descriptive purposes only.
BreakoutWatch is not affiliated with Investor's Business Daily or
with Mr. William O'Neil. Our site, research and analysis is
supported entirely by subscription and is free from advertising.