| Market Summary | Weekly Breakout Report | Top Breakout Choices | Top 2nd Chances | New Features | Tip of the Week |
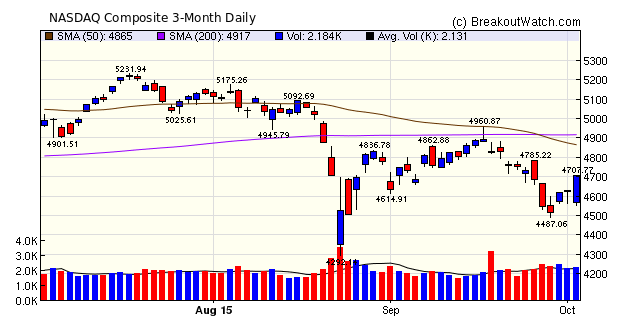
Friday's market action met William O'Neil's definition of a "Follow Through Day (FTD)". That is, the market closed higher on the fourth day after a mid-day reversal. Under this definition, the first day of the rally came on Tuesday when a mid-day reversal saw the NASDAQ close above its intra-day low. For CANSLIM adherents, this is a signal that the downward trend has reversed and it is safe to re-enter the markets. Our trend signal remains negative, however, although I would expect it to turn up shortly, if the rally continues in the early part of next week.
In 2011 I did an analysis of FTDs and found that of 18 clearly defined bottoms an FTD occurred for only 10 of them. Consequently, I prefer to wait for my own trend signal, which is more conservative, to turn up .
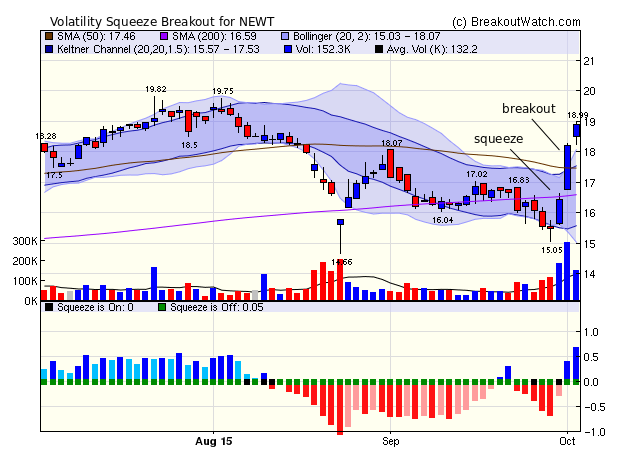
The number of breakouts rose from 33 to 41 this week. Volatility Squeeze breakouts again dominated with 23 breakouts compared to 13 for our cup and handle list. The top breakout again followed a pattern that I have emphasized again and again as a common feature of strong breakouts - that the breakout is preceded by a move up on strong volume.
| Breakouts for Week Beginning 09/28/15 | |||||||||
| Brkout Date | Symbol | Base | Squeeze | BrkoutOut Price | Brkout Day Close | RS Rank* | Last Close | Current % off BOP | Gain at Intraday High |
|---|---|---|---|---|---|---|---|---|---|
| 10/01/15 | NEWT | SQZ | Y | 16.38 | 18.25 | 81 | 18.91 | 15.45 | 15.45 |
| 10/01/15 | TYL | CwH | N | 152.91 | 164.39 | 96 | 168.01 | 9.88 | 9.88 |
| 10/01/15 | EW | SQZ | Y | 142.24 | 149 | 88 | 154.55 | 8.65 | 8.65 |
| 10/01/15 | VRSK | SQZ | Y | 73.92 | 78.16 | 86 | 79.88 | 8.06 | 8.06 |
| 10/02/15 | DTEA | HSB | N | 15.84 | 16.85 | 21 | 16.85 | 6.38 | 6.38 |
| 10/01/15 | JNPR | SQZ | Y | 25.75 | 26.04 | 87 | 27.17 | 5.51 | 5.51 |
| 09/29/15 | CMN | CwH | N | 53.88 | 54.48 | 89 | 56.12 | 4.16 | 5.51 |
| 09/29/15 | IPGP | HSB | N | 74.00 | 74.55 | 49 | 77.3 | 4.46 | 4.46 |
| 09/29/15 | ROCK | SQZ | Y | 17.69 | 17.85 | 81 | 18.35 | 3.73 | 4.13 |
| 09/29/15 | NCI | SQZ | Y | 15.77 | 15.8 | 88 | 16.4 | 3.99 | 3.99 |
| 09/30/15 | MATX | SQZ | Y | 38.08 | 38.45 | 87 | 39.41 | 3.49 | 3.49 |
| 10/01/15 | IBKR | SQZ | Y | 39.48 | 40.66 | 94 | 38.99 | -1.24 | 2.99 |
| 10/01/15 | CHMT | SQZ | Y | 28.66 | 29.4 | 87 | 29.51 | 2.97 | 2.97 |
| 09/28/15 | RAI | SQZ | Y | 43.03 | 43.42 | 95 | 44.01 | 2.28 | 2.95 |
| 09/30/15 | HDB | CwH | N | 60.83 | 61.10 | 90 | 62.6 | 2.91 | 2.91 |
| 10/01/15 | VRSN | CwH | N | 71.29 | 71.42 | 93 | 73.31 | 2.83 | 2.83 |
| 10/01/15 | NCI | SQZ | Y | 15.95 | 16.39 | 88 | 16.4 | 2.82 | 2.82 |
| 09/28/15 | IRET | CwH | N | 7.68 | 7.69 | 81 | 7.6 | -1.04 | 2.34 |
| 10/01/15 | WNR | SQZ | Y | 44.15 | 44.49 | 82 | 45.17 | 2.31 | 2.31 |
| 10/01/15 | AZO | SQZ | Y | 724.40 | 736.35 | 92 | 740.78 | 2.26 | 2.26 |
| 10/01/15 | EXPO | CwH | N | 44.96 | 45.17 | 85 | 45.9 | 2.09 | 2.09 |
| 09/30/15 | TLMR | SQZ | Y | 16.36 | 16.67 | 86 | 15.97 | -2.38 | 1.89 |
| 09/29/15 | IRET | CwH | N | 7.72 | 7.86 | 87 | 7.6 | -1.55 | 1.81 |
| 10/01/15 | FISV | SQZ | Y | 86.65 | 87.51 | 91 | 88.22 | 1.81 | 1.81 |
| 10/01/15 | LMOS | HSB | N | 12.19 | 12.33 | 26 | 12.38 | 1.56 | 1.56 |
| 10/02/15 | SIX | SQZ | Y | 46.33 | 46.95 | 90 | 46.95 | 1.34 | 1.34 |
| 10/01/15 | CSGS | SQZ | Y | 30.80 | 31.1 | 86 | 31.21 | 1.33 | 1.33 |
| 10/02/15 | CALM | CwH | N | 58.72 | 59.48 | 95 | 59.48 | 1.29 | 1.29 |
| 10/01/15 | ACN | SQZ | Y | 98.29 | 98.44 | 86 | 99.39 | 1.12 | 1.12 |
| 10/01/15 | TGT | SQZ | Y | 78.71 | 79.51 | 82 | 79.53 | 1.04 | 1.04 |
| 10/02/15 | EGBN | CwH | N | 45.65 | 46.05 | 93 | 46.05 | 0.88 | 0.88 |
| 09/30/15 | DMF | CwH | N | 9.40 | 9.41 | 83 | 9.48 | 0.85 | 0.85 |
| 09/29/15 | HTBI | SQZ | Y | 18.54 | 18.67 | 93 | 18.63 | 0.49 | 0.81 |
| 09/29/15 | FR | CwH | N | 20.99 | 21.11 | 87 | 21.14 | 0.71 | 0.71 |
| 09/29/15 | EVN | CwH | N | 12.98 | 13.00 | 81 | 12.8 | -1.39 | 0.69 |
| 10/02/15 | AZO | SQZ | Y | 736.64 | 740.78 | 94 | 740.78 | 0.56 | 0.56 |
| 10/01/15 | FICO | SQZ | Y | 84.57 | 84.95 | 88 | 84.02 | -0.65 | 0.45 |
| 10/02/15 | HME | SQZ | Y | 74.91 | 75.2 | 90 | 75.2 | 0.39 | 0.39 |
| 10/02/15 | PML | CwH | N | 12.07 | 12.10 | 81 | 12.1 | 0.25 | 0.25 |
| 10/02/15 | CHMT | SQZ | Y | 29.46 | 29.51 | 90 | 29.51 | 0.17 | 0.17 |
| 09/30/15 | VCIT | DB | N | 85.36 | 85.42 | 74 | 85.35 | -0.01 | 0.09 |
| Weekly Average (41 breakouts) | 2.43 | 2.95 | |||||||
| *RS Rank on day before breakout. | |||||||||
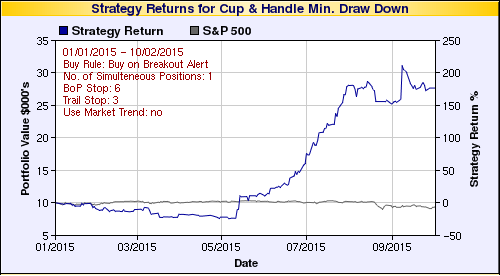
New Strategies in the Cup and Handle Backtest Tool
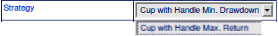
- Cup and Handle Minimum Drawdown
- This backtest is based on the cup and handle stock characteristics that were determined to give the best return for the least drawdown during 2015. In other words, this is a low risk strategy
- Cup and Handle Maximum Return
- This backtest is based on the cup and handle stock characteristics that were determined to give the maximum return regardless of drawdown during 2015. In other words, this is a higher risk strategy that offers the best possible return.
These two strategies are further explained below.
The backtest tool allows you to develop your own strategies and/or see how the two basic strategies need to be adjusted for changing market conditions.
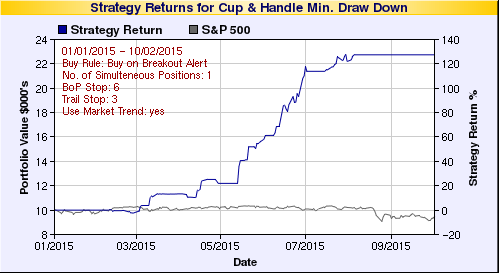
Suggested Strategy for Optimum and Maximum Breakout Returns
- For the optimal return (best profit at least risk) I now suggest the following trading strategy for cup with handle stocks:
- Each day, create a personal watchlist of stocks that satisfy
- RS Rank must be at least 90
- Industry Rank must be in the top 20 percentile (i.e. have a rank less than 43 in our industry ranking scheme
- Average daily volume >= 100,000.
- If market trend is positive, buy on alert
- Sell at next open if volume at end of breakout day is less than 2 times average 50 day volume
- Sell if stock drops 6% or more from the breakout price.
- If stock rises above breakout price after purchase, set a 3% trailing stop by monitoring daily high's and setting a stop loss at 3% of the maximum high after breakout. Adjust daily if necessary.
- Sell if trailing stop met intraday.
This strategy would have returned 127% year-to-date.
- For the greatest return (best profit regardless of risk) I now suggest the following trading strategy for cup with handle stocks:
- Each day, create a personal watchlist of stocks that satisfy
- RS Rank must be at least 80 (all stocks on the watchlist have an RS of at least 80)
- Industry Rank must be in the top 70 percentile (i.e. have a rank less than 150 in our industry ranking scheme
- Average daily volume >= 100,000.
- Regardless of market trend, buy on alert
- Sell at next open if volume at end of breakout day is less than 1.5 times average 50 day volume
- Sell if stock drops 6% or more from the breakout price.
- If stock rises above breakout price after purchase, set a 3% trailing stop by monitoring daily high's and setting a stop loss at 3% of the maximum high after breakout. Adjust daily if necessary.
- Sell if trailing stop met intraday.
This strategy would have returned176% year-to-date.
| Index | Value | Change Week | Change YTD | Trend | ||||||||||||||||||||||||||||||||||||
|---|---|---|---|---|---|---|---|---|---|---|---|---|---|---|---|---|---|---|---|---|---|---|---|---|---|---|---|---|---|---|---|---|---|---|---|---|---|---|---|---|
| Dow | 16472.4 | 0.97% | -7.58% | Down | ||||||||||||||||||||||||||||||||||||
| NASDAQ | 4707.77 | 0.45% | -0.6% | Down | ||||||||||||||||||||||||||||||||||||
| S&P 500 | 1951.36 | 1.04% | -5.22% | Down | ||||||||||||||||||||||||||||||||||||
1The Market Signal is derived
from our proprietary market model. The market model is
described on the site.
2The site also shows industry rankings based on fundamentals, combined technical and fundamentals, and on price alone. The site also shows daily industry movements. |
||||||||||||||||||||||||||||||||||||||||
|
Category
|
Symbol
|
Company Name
|
Expected Gain1
|
|---|---|---|---|
| Best Overall | BSQR | BSQUARE Corporation | 95 |
| Top Technical | BSQR | BSQUARE Corporation | 95 |
| Top Fundamental | HTBK | Heritage Commerce Corp | 75 |
| Top Tech. & Fund. | UVE | UNIVERSAL INSURANCE HOLDINGS INC | 55 |
|
Category
|
Symbol
|
Company Name
|
Expected Gain1
|
|---|---|---|---|
| Best Overall | IRET | Investors Real Estate Trust | 53 |
| Top Technical | CALM | Cal-Maine Foods, Inc. | 41 |
| Top Fundamental | HDB | HDFC Bank Limited | 40 |
| Top Tech. & Fund. | HDB | HDFC Bank Limited | 40 |
If you received this newsletter from a friend and you would like to receive it regularly please go to the BreakoutWatch.com site and enter as a Guest. You will then be able to register to receive the newsletter.
Copyright © 2015 NBIcharts, LLC dba BreakoutWatch.com. All rights
reserved.
" BreakoutWatch," the BreakoutWatch.com "eye" logo, and the slogan
"tomorrow's breakouts today" are service marks of NBIcharts LLC.
All other marks are the property of their respective owners, and
are used for descriptive purposes only.
BreakoutWatch is not affiliated with Investor's Business Daily or
with Mr. William O'Neil. Our site, research and analysis is
supported entirely by subscription and is free from advertising.