Breakoutwatch Weekly Newsletter 12/04/15

You are receiving this email because you are or were a BreakoutWatch.com subscriber, or have subscribed to our weekly newsletter. This newsletter summarizes the breakout events of the week and provides additional guidance that does not fit into our daily format. It is published each weekend.

Weekly Commentary
The markets made only modest gains this week. The indexes plunged on Thursday as stimulus measures by the European Central Bank fell  below expectations but recovered most of the losses on Friday in reaction to a strong employment report. Overall the economy is looking stronger with gains in construction spending (1%), Factory Orders (1.5%), Mortgage Applications (up 30% year-on-year) and unemployment claims trending down (source: Succinct Summation  of Week's Events). It now seems certain that a small rate increase will result from the next FOMC meeting on 15-16 December.

The NASDAQ Composite receded from a breakout of the cup and handle pattern that I drew attention to in the last newsletter. IF  Friday's strength  continues into next week,  then we may see another attempt to breakthrough the new resistance level at 5176.

NASDA Comp. Chart
Weekly Breakout Report

Cup and Handle pattern stocks returned to lead the number of breakouts this week.
Breakouts Summary by Watchlist for Week Beginning 11/30/15
List Breakouts Avg. Gain
CwH 23 1.7
SQZ 16 2.2
HTF 2 9.38
HSB 1 14.49
Breakouts Detail for Week Beginning 11/30/15
Brkout Date Symbol Base Squeeze BrkoutOut Price Brkout Day Close RS Rank* Last Close Current % off BOP Gain at Intraday High
11/30/15 SMED SQZ Y 8.21 9.07 96 9.17 11.69 18.39
12/01/15 EDUC HTF N 14.50 16.35 99 16.68 15.03 17.03
11/30/15 FOMX HSB Y 7.52 7.99 12 8.61 14.49 16.49
12/01/15 EMKR CwH N 7.38 8.09 88 8.4 13.82 13.82
11/30/15 ORMP CwH N 8.46 9.10 97 8.64 2.13 11.23
12/02/15 RDCM SQZ Y 12.28 12.93 82 13.26 7.98 7.98
12/02/15 ZAGG CwH N 10.49 10.55 95 11.22 6.96 6.96
11/30/15 DVAX SQZ Y 26.24 27.89 83 27.11 3.32 6.33
12/04/15 SA SQZ Y 8.38 8.9 93 8.9 6.21 6.21
12/01/15 TNK SQZ Y 7.06 7.31 92 7.47 5.81 5.81
12/02/15 VUZI CwH N 6.30 6.63 95 6.26 -0.63 5.24
12/02/15 ZEN CwH N 26.07 26.65 85 27.33 4.83 4.83
12/02/15 ORBK CwH N 20.45 20.75 90 21.43 4.79 4.79
11/30/15 NPTN CwH N 10.12 10.38 99 10.59 4.64 4.64
11/30/15 HMIN CwH N 30.77 30.85 82 32.14 4.45 4.45
12/04/15 FPRX HTF N 38.98 40.43 99 40.43 3.72 3.72
11/30/15 BIDU CwH N 210.90 217.97 89 208.3 -1.23 3.35
11/30/15 ATTU SQZ Y 13.49 13.67 84 13.45 -0.30 3.26
11/30/15 NCMI CwH N 15.61 15.87 82 16.07 2.95 3.14
12/01/15 LOCK CwH Y 14.96 15.34 93 14.65 -2.07 2.54
11/30/15 AOSL CwH Y 9.64 9.74 91 9.88 2.49 2.49
12/02/15 FORM SQZ Y 8.93 9.13 83 9 0.78 2.24
11/30/15 INWK CwH N 8.38 8.56 93 8 -4.53 2.15
12/04/15 NPTN CwH N 10.38 10.59 99 10.59 2.02 2.02
11/30/15 POWI SQZ Y 51.19 51.7 86 52.12 1.82 1.82
12/04/15 SERV CwH N 38.35 39.00 88 39 1.69 1.69
11/30/15 LIND CwH N 11.00 11.03 82 11.04 0.36 1.45
12/03/15 AGM CwH N 31.25 31.64 82 31.22 -0.10 1.25
12/01/15 EGL CwH Y 35.13 35.57 84 33.95 -3.36 1.25
12/02/15 IIVI SQZ Y 18.94 19.15 84 19.12 0.95 1.11
12/01/15 WASH SQZ Y 40.91 41.21 80 39.75 -2.84 0.73
12/03/15 AHS SQZ Y 30.24 30.46 90 30.32 0.26 0.73
12/02/15 OLED CwH N 55.50 55.90 97 54.71 -1.42 0.72
12/02/15 PRI CwH N 52.42 52.60 80 52.67 0.48 0.48
11/30/15 PGI CwH N 13.87 13.87 96 13.93 0.43 0.43
12/02/15 DATE SQZ Y 7.05 7.08 91 7 -0.71 0.43
12/04/15 IART CwH N 64.59 64.86 85 64.86 0.42 0.42
12/01/15 PGI SQZ Y 13.88 13.91 95 13.93 0.36 0.36
12/02/15 MNRO SQZ Y 74.34 74.56 90 74.58 0.32 0.32
12/02/15 MSEX SQZ Y 25.67 25.7 84 25.57 -0.39 0.12
12/03/15 MNRO SQZ Y 74.57 74.57 91 74.58 0.01 0.01
12/04/15 BDBD CwH N 10.97 10.97 89 10.97 0.00 0
Weekly Average (42 breakouts) 2.56 4.11
*RS Rank on day before breakout.

New Features This Week

No new  features this week although a couple of bug fixes  deserve a mention.

Chart Browser: This was broken since I made the watchlist pages responsive. It is now functioning  again and is a great way to rapidly scan through the charts of  stocks selected by your watchlist filters.

Database Search: This function does not work in the  Chrome browser since  Google stopped support  for JAVA due to security concerns. However, it does work in Firefox. There was a bug that threw a database error that I fixed yesterday
Top Tip of the Week

Search our Database to Find Quality CAN SLIM\AE Stocks

Are you looking for stocks that meet a specific set of CAN SLIM\AE criteria but which  may not currently be on any of our watchlists. If so, then our database search may be the answer for you.

Each day we recalculate all our metrics for all common US stocks (typically around 6,000). You can select stocks that meet any technical  or fundamental metric the CAN SLIM\AE investor could wish for, regardless of whether it meets our criteria for a particular  watchlist. You do this through  our database search function.

The Database Search is accessed from the Mine for Candidates Menu option. There are two ways to search the database. You can either select one of our 'Top 100' lists or build a more selective set of criteria.

Select a Top 100 List


To select one of the top 100 lists, simply select one and click the Search Database button.


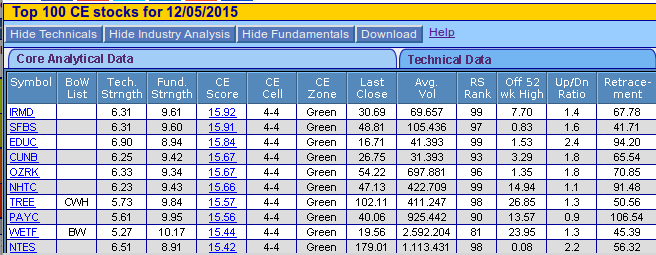
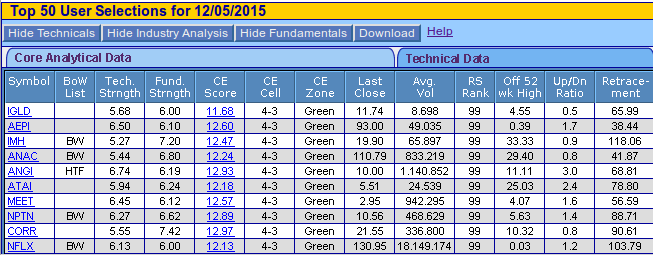
These searches will return the 100 stocks with the highest technical score, fundamental score or CANTATA Evaluator (CE) score from our database. As an example, here are the top 10 stocks from our current Top 100 CE search.

Top CE


The display will open with the core analytical and technical data displayed. Clicking the 'Show Industry Analysis' or 'Show Fundamentals' will buttons will show that data also. Click a 'Hide' button to reduce the display width to fit within your monitor.

More Selective Search

 To be more selective, first choose a group of stocks to search on:


Then choose a set of selection criteria, you can search by Zone, Technical Criteria, Fundamental Criteria, or any combination thereof.

For example, most breakouts come from stocks in zone 4-3 (that means top technicals and moderately strong fundamentals). To select stocks in Zone 4-3 just click the zone diagram as shown:


Finally, choose a sort criterion and click the database search button. The search will return the top 50 stocks meeting the search criteria.


Here are the top 10 that the search would display today.

zone 4-3

Note: This function will not work in the Chrome browser. It is supported in Firefox, but you will be prompted to confirm that you want the application to run.
 
Major Index Summary
Index Value Change Week Change YTD Trend1
Dow 17847.6
0.28% 0.14% Up
NASDAQ 5142.27
0.29% 8.58% Up
S&P 500 2091.69
0.08% 1.59% Up
1The Market Trend is derived from our proprietary market model. The market model is described on the site.
2The site also shows industry rankings based on fundamentals, combined technical and fundamentals, and on price alone. The site also shows daily industry movements.
Best Performing Index
1 Week 13 Weeks 26 Weeks Year-to-Date
NASDAQ Composite
0.29 %
Dow Jones
9.79 %
NASDAQ Composite
1.46 %
NASDAQ Composite
8.58 %
Best Performing Industry (by average technical score over each period)
1 Week 3 Weeks 13 Weeks 26 Weeks
Cigarettes Cigarettes Music & Video Stores Tobacco Products - Other
Most Improved Industry (by change in technical rank2)
Beverages - Wineries & Distillers
+ 61
Photographic Equipment & Supplies
+ 146
Diversified Computer Systems
+ 161
Long Distance Carriers
+ 161
Charts of each industry rank and performance over 12 months are available on the site
Top Breakout Choices: Stocks on our Cup-and-Handle list with best expected gain if they breakout
Category
Symbol
Company Name
Expected Gain1
Best Overall BZUN
Baozun Inc.
108
Top Technical BZUN
Baozun Inc.
108
Top Fundamental TREE
LendingTree, Inc.
48
Top Tech. & Fund. TREE
LendingTree, Inc.
48
1This is the gain predicted by our Expected Gain model within 6 months of breakout which uses the volume on breakout as a predictive term. Because the model variance is +/- 38% the expectation can be negative.
Top Second Chances: Stocks that broke out this week and are still in buyable range
Category
Symbol
Company Name
Expected Gain1
Best Overall VUZI
Vuzix Corporation
110
Top Technical ORMP
Oramed Pharmaceuticals Inc.
96
Top Fundamental ORBK
Orbotech Ltd.
49
Top Tech. & Fund. ORBK
Orbotech Ltd.
49
1This is the gain predicted by our Expected Gain model within 6 months of breakout which uses the volume on breakout as a predictive term. Because the model variance is +/- 38% the expectation can be negative.

If you received this newsletter from a friend and you would like to receive it regularly please go to the BreakoutWatch.com site and enter as a Guest. You will then be able to register to receive the newsletter.

Copyright (c) 12/04/2015 NBIcharts, LLC dba BreakoutWatch.com. All rights reserved.
" BreakoutWatch," the BreakoutWatch.com "eye" logo, and the slogan "tomorrow's breakouts today" are service marks of NBIcharts LLC. All other marks are the property of their respective owners, and are used for descriptive purposes only.

BreakoutWatch is not affiliated with Investor's Business Daily or with Mr. William O'Neil. Our site, research and analysis is supported entirely by subscription and is free from advertising.