Breakoutwatch Weekly Newsletter 01/08/16

You are receiving this email because you are or were a BreakoutWatch.com subscriber, or have subscribed to our weekly newsletter. This newsletter summarizes the breakout events of the week and provides additional guidance that does not fit into our daily format. It is published each weekend.

Weekly Commentary

May the  New Year bring you health, wealth and happiness. It can only  get better from here.

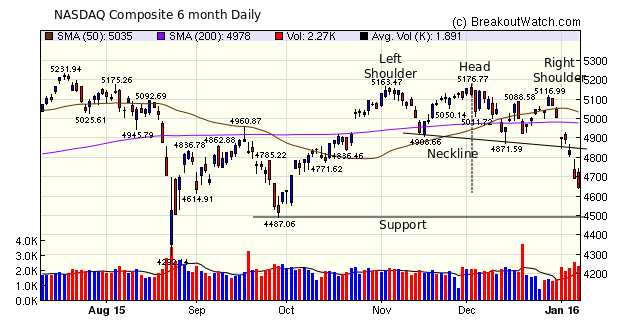
I took a break from writing the newsletter over the holidays. Had I not done so,  I would have warned that the NASDAQ was in a head and shoulders top pattern, which is bearish. The pattern was completed on Wednesday when the index crashed through the neckline at the open. Normally, the expected decline after completing the pattern, is equal to the vertical distance between the neckline and the head or 280 points in  this case. That predicts a bottom at about 4620 (4900 - 280 ), while the next support line is September's low of 4490.

Our market signals remained down since my last newsletter on December 12, so I hope  you took my advice then to not open any new positions. I wish I had taken my own advice :(.
NASDAQ Chart
Weekly Breakout Report

The breakouts summary for the week confirms that it is best to wait out the storm.
Breakouts Summary by Watchlist for Week Beginning 01/04/16
List Breakouts Avg. Gain
CwH 11 -1.67
SQZ 10 -0.32
HTF 1 0.09
HSB 2 -2.68
Breakouts Detail for Week Beginning 01/04/16
Brkout Date Symbol Base Squeeze BrkoutOut Price Brkout Day Close RS Rank* Last Close Current % off BOP Gain at Intraday High
01/07/16 VCRA SQZ Y 12.72 13.45 93 14.2 11.64 11.95
01/04/16 RGR CwH N 61.37 61.39 92 58.1 -5.33 6.79
01/05/16 FSLR CwH N 67.80 72.03 98 65.8799 -2.83 6.24
01/04/16 LULU HSB N 53.15 55.86 37 53.88 1.37 5.1
01/04/16 SPNS SQZ Y 10.22 10.27 81 10.41 1.86 3.82
01/07/16 WBMD CwH N 49.88 50.12 90 51.3799 3.01 3.27
01/04/16 BXLT CwH N 40.24 41.17 92 39.99 -0.62 3.16
01/06/16 AGM CwH N 32.94 33.92 90 30.91 -6.16 2.98
01/08/16 SGU SQZ Y 7.82 7.97 81 7.97 1.92 2.81
01/04/16 ANFI SQZ Y 9.10 9.34 87 8.04 -11.65 2.64
01/06/16 KANG CwH N 21.49 21.61 97 22.04 2.56 2.56
01/07/16 SA SQZ Y 9.16 9.36 96 8.92 -2.62 2.18
01/05/16 CHUY CwH N 34.09 34.79 95 34 -0.26 2.05
01/08/16 EEFT SQZ Y 71.63 72.95 91 72.95 1.84 2.04
01/05/16 NJR CwH N 34.07 34.08 81 33.59 -1.41 1.44
01/06/16 ATHN SQZ Y 163.17 165.3 89 159.76 -2.09 1.31
01/07/16 USLV HSB N 10.72 10.85 9 10 -6.72 1.21
01/05/16 SPWH CwH N 13.20 13.25 95 12.8 -3.03 1.06
01/04/16 CHFN SQZ Y 13.22 13.3 82 13.09 -0.98 0.83
01/07/16 MB SQZ Y 15.32 15.42 84 14.86 -3.00 0.65
01/07/16 TMUS CwH N 40.35 40.51 89 39.84 -1.26 0.4
01/06/16 MDAS SQZ Y 30.97 31.06 98 30.92 -0.16 0.29
01/05/16 NOC CwH N 191.87 192.39 91 185.95 -3.09 0.27
01/07/16 VPCOU HTF N 11.75 11.75 96 11.76 0.09 0.09
Weekly Average (24 breakouts) -1.12 2.71
*RS Rank on day before breakout.
New Features This Week

I have rewritten the database search function so it no longer requires Java. More below.
 
Top Tip of the Week

How to Find Top Rated CAN SLIM ® Stocks

The DataBase Search function (on the Mine for Candidates menu) is designed to allow you to find CAN SLIM ® candidates that may not be on our watchlists.

For example, suppose I wanted to find high RS rank stocks with excellent earnings and future earnings potential, I could setup a search as follows:

Database Search for CANSLIM stocks

Clicking the Search Database button yields 6 stocks, one of which is on our Basewatch list, meaning that it is ascending the right side  of a cup. The display shows shows tabs for Core, Technical, Industry and Fundamental indicators. The first display is of the core indicators:

CANSLIM search results

Clicking the  Fundamentals tab gives us all the CAN SLIM ® fundamentals (note that there are some stocks for which we do not have fundamental data):

CANSLIM Fundamentals

Conclusion

The Database Search function provides a powerful means to find stocks meeting whatever mix of technical and fundamental criteria you wish.


Major Index Summary
Index Value Change Week Change YTD Trend1
Dow 16346.5
-6.19% -6.19% Down
NASDAQ 4643.63
-7.26% -7.26% Down
S&P 500 1922.03
-5.96% -5.96% Down
1The Market Trend is derived from our proprietary market model. The market model is described on the site.
2The site also shows industry rankings based on fundamentals, combined technical and fundamentals, and on price alone. The site also shows daily industry movements.
Best Performing Index
1 Week 13 Weeks 26 Weeks Year-to-Date
S&P 500
-4.5 %
NASDAQ Composite
-3.87 %
NASDAQ Composite
-7.08 %
S&P 500
-5.96 %
Best Performing Industry (by average technical score over each period)
1 Week 3 Weeks 13 Weeks 26 Weeks
Regional - Mid-Atlantic Banks Regional - Midwest Banks Auto Parts Stores Cigarettes
Most Improved Industry (by change in technical rank2)
Drug Related Products
+ 96
Consumer Services
+ 62
Research Services
+ 134
Drug Related Products
+ 160
Charts of each industry rank and performance over 12 months are available on the site
Top Breakout Choices: Stocks on our Cup-and-Handle list with best expected gain if they breakout
Category
Symbol
Company Name
Expected Gain1
Best Overall CLCD
CoLucid Pharmaceuticals, Inc.
98
Top Technical CLCD
CoLucid Pharmaceuticals, Inc.
98
Top Fundamental SEDG
SolarEdge Technologies, Inc.
56
Top Tech. & Fund. QIHU
Qihoo 360 Technology Co. Ltd.
42
1This is the gain predicted by our Expected Gain model within 6 months of breakout which uses the volume on breakout as a predictive term. Because the model variance is +/- 38% the expectation can be negative.
Top Second Chances: Stocks that broke out this week and are still in buyable range
Category
Symbol
Company Name
Expected Gain1
Best Overall SPWH
Sportsman's Warehouse Holdings, Inc.
77
Top Technical KANG
iKang Healthcare Group, Inc.
57
Top Fundamental CHUY
Chuy's Holdings, Inc.
37
Top Tech. & Fund. CHUY
Chuy's Holdings, Inc.
37
1This is the gain predicted by our Expected Gain model within 6 months of breakout which uses the volume on breakout as a predictive term. Because the model variance is +/- 38% the expectation can be negative.

If you received this newsletter from a friend and you would like to receive it regularly please go to the BreakoutWatch.com site and enter as a Guest. You will then be able to register to receive the newsletter.

Copyright (c) 01/08/2016 NBIcharts, LLC dba BreakoutWatch.com. All rights reserved.
" BreakoutWatch," the BreakoutWatch.com "eye" logo, and the slogan "tomorrow's breakouts today" are service marks of NBIcharts LLC. All other marks are the property of their respective owners, and are used for descriptive purposes only.

BreakoutWatch is not affiliated with Investor's Business Daily or with Mr. William O'Neil. Our site, research and analysis is supported entirely by subscription and is free from advertising.