Breakoutwatch Weekly Newsletter 02/13/16

You are receiving this email because you are or were a BreakoutWatch.com subscriber, or have subscribed to our weekly newsletter. This newsletter summarizes the breakout events of the week and provides additional guidance that does not fit into our daily format. It is published each weekend.

Weekly Commentary
 The major indexes continued their slide this week although the damage was mitigated by Friday's rally which saw the NASDAQ gain 1.2%, the S&P 500, 0.7% and the DJI 0.4%. The energy sector led the way with a 12% gain following rumors that OPEC were finally going to cooperate on production  cuts. Economic data released on Friday also helped lift the markets as retail sales improved as did job openings and jobless claims continued to fall.

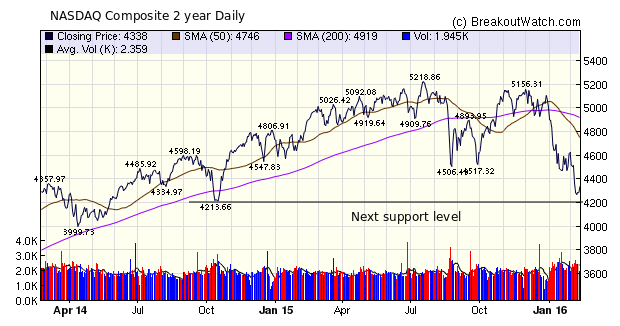
The NASDAQ has now fallen 17% from last July's high to a level not seen since October 2014, having crashed through the double bottom set in October last year. The next support level is at 4213 which would be a 19% decline, just short  of the  somewhat arbitrary definition  of a "correction" at 20%.

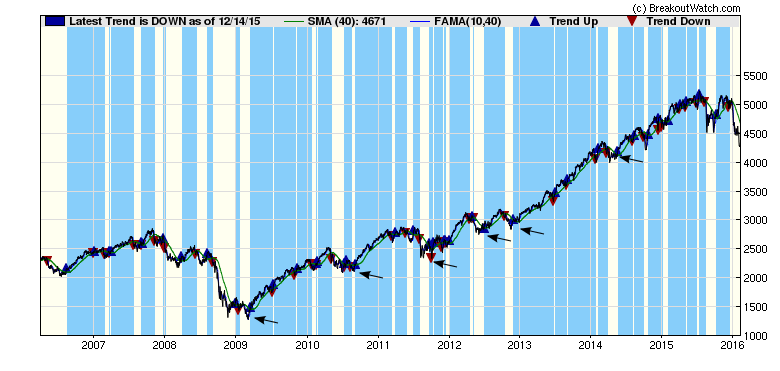
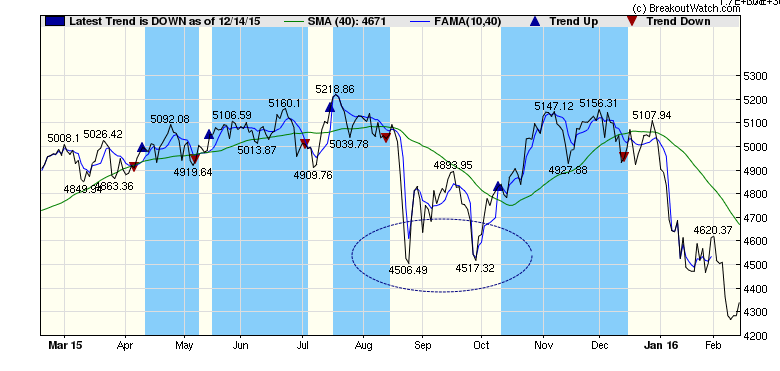
Our market signals still register a negative trend and so we do not advise opening new long positions, although some breakouts can still give strong short term gains as our Weekly  Breakout Report shows.

NASDAQ Chart
 
Weekly Breakout Report

Breakouts Summary by Watchlist for Week Beginning 02/08/16
List Breakouts Avg. Gain
CwH 15 2.24
SQZ 11 0.95
HSB 1 9.17
Breakouts Detail for Week Beginning 02/08/16
Brkout Date Symbol Base Squeeze BrkoutOut Price Brkout Day Close RS Rank* Last Close Current % off BOP Gain at Intraday High
02/11/16 AMRK SQZ Y 17.94 19.24 99 19.84 10.59 10.98
02/10/16 OSTK HSB N 12.38 13.05 11 13.515 9.17 9.29
02/11/16 COLL SQZ Y 17.70 18.98 81 19.13 8.08 8.25
02/11/16 AU CwH N 10.91 11.38 98 11.6508 6.79 7.33
02/11/16 GOLD CwH N 85.20 87.61 98 90.06 5.70 5.96
02/09/16 BKH CwH N 51.53 52.03 95 54.44 5.65 5.72
02/09/16 HII SQZ Y 125.08 125.465 84 131.27 4.95 5.06
02/11/16 AEM CwH N 33.95 35.23 97 35.62 4.92 4.98
02/11/16 PAAS CwH N 8.55 8.66 88 8.84 3.39 3.86
02/08/16 RNR SQZ Y 109.88 112.56 84 113.03 2.87 3.15
02/11/16 ASA CwH N 9.08 9.28 85 9.35 2.97 3.08
02/11/16 ABX CwH N 11.92 11.96 98 12.225 2.56 2.77
02/11/16 FNV CwH N 53.24 53.58 88 54.41 2.20 2.31
02/10/16 BGS CwH N 36.67 37.03 94 36.84 0.46 1.88
02/08/16 PCK SQZ Y 10.19 10.33 88 10.24 0.49 1.86
02/08/16 FDP SQZ Y 40.02 40.465 83 40.13 0.27 1.75
02/08/16 HTR CwH N 23.60 23.88 89 23.86 1.10 1.19
02/12/16 COLL SQZ Y 18.99 19.13 93 19.13 0.74 0.9
02/10/16 ALG SQZ Y 52.31 52.57 81 50.5 -3.46 0.63
02/09/16 SNC SQZ Y 9.88 9.92 84 9.79 -0.91 0.61
02/09/16 ZAGG SQZ Y 10.33 10.37 98 9.07 -12.20 0.39
02/09/16 PCK SQZ Y 10.34 10.38 92 10.24 -0.97 0.39
02/12/16 PNRA CwH N 198.78 199.41 88 199.41 0.32 0.32
02/09/16 KO CwH N 43.26 43.27 86 43.07 -0.44 0.14
02/10/16 ENX CwH N 13.29 13.30 91 13.17 -0.90 0.08
02/09/16 ENX CwH N 13.29 13.29 90 13.17 -0.90 0.08
02/08/16 STR CwH N 25.01 25.01 95 24.95 -0.24 0.04
Weekly Average (27 breakouts) 1.97 3.07
*RS Rank on day before breakout.
New Features This Week

No new features this week.
 
Top Tip of the Week

How to Recognize a Market Bottom

So when will we know when the market has hit bottom and turned up? Well we can't know for certain, but our Trend Reversal Signal (TRS) tool does a pretty good job at it.

The chart below shows the trend reversal signals (TRS) for the NASDAQ Composite for the last 10 years. You can see that it recognized the April 2009 market bottom and most of the intermediate bottoms since. Of particular note, is that there was a false bottom in September 2015 which the TRS tool did not signal as a trend reversal. See second chart below.

Also note that the TRS tool signaled the current downturn on December 14 last year when the NASDAQ closed at 4952. The index has fallen 12% since  then.

10 Year Trend Reversal Signals

10 yr TRS
1 Year Trend Reversal Signals
1Yr TRS
Major Index Summary
Index Value Change Week Change YTD Trend1
Dow 15973.8
-1.43% -8.33% Down
NASDAQ 4337.51
-0.59% -13.38% Down
S&P 500 1864.78
-0.81% -8.77% Down
1The Market Trend is derived from our proprietary market model. The market model is described on the site.
2The site also shows industry rankings based on fundamentals, combined technical and fundamentals, and on price alone. The site also shows daily industry movements.
Best Performing Index
1 Week 13 Weeks 26 Weeks Year-to-Date
NASDAQ Composite
-0.59 %
Dow Jones
-7.37 %
Dow Jones
-8.6 %
Dow Jones
-8.33 %
Best Performing Industry (by average technical score over each period)
1 Week 3 Weeks 13 Weeks 26 Weeks
Music & Video Stores Water Utilities Auto Parts Stores Auto Parts Stores
Most Improved Industry (by change in technical rank2)
Silver
+ 46
Music & Video Stores
+ 199
Silver
+ 173
Silver
+ 175
Charts of each industry rank and performance over 12 months are available on the site
Top Breakout Choices: Stocks on our Cup-and-Handle list with best expected gain if they breakout
Category
Symbol
Company Name
Expected Gain1
Best Overall OSUR
OraSure Technologies, Inc.
91
Top Technical OSUR
OraSure Technologies, Inc.
91
Top Fundamental XRS
TAL Education Group
34
Top Tech. & Fund. XRS
TAL Education Group
34
1This is the gain predicted by our Expected Gain model within 6 months of breakout which uses the volume on breakout as a predictive term. Because the model variance is +/- 38% the expectation can be negative.
Top Second Chances: Stocks that broke out this week and are still in buyable range
Category
Symbol
Company Name
Expected Gain1
Best Overall PAAS
Pan American Silver Corp.
78
Top Technical HTR
Brookfield Total Return Fund Inc.
8
Top Fundamental BGS
B&G Foods, Inc.
36
Top Tech. & Fund. BGS
B&G Foods, Inc.
36
1This is the gain predicted by our Expected Gain model within 6 months of breakout which uses the volume on breakout as a predictive term. Because the model variance is +/- 38% the expectation can be negative.

If you received this newsletter from a friend and you would like to receive it regularly please go to the BreakoutWatch.com site and enter as a Guest. You will then be able to register to receive the newsletter.

Copyright (c) 02/12/2016 NBIcharts, LLC dba BreakoutWatch.com. All rights reserved.
" BreakoutWatch," the BreakoutWatch.com "eye" logo, and the slogan "tomorrow's breakouts today" are service marks of NBIcharts LLC. All other marks are the property of their respective owners, and are used for descriptive purposes only.

BreakoutWatch is not affiliated with Investor's Business Daily or with Mr. William O'Neil. Our site, research and analysis is supported entirely by subscription and is free from advertising.