Breakoutwatch Weekly Newsletter 04/02/16
You are receiving this email because you are or were a BreakoutWatch.com
subscriber, or have subscribed to our weekly newsletter. This newsletter
summarizes the breakout events of the week and provides additional
guidance that does not fit into our daily format. It is published each
weekend.
Weekly Commentary
New Feature this week: Top 10
cup and handle stocks to watch next week. See below.
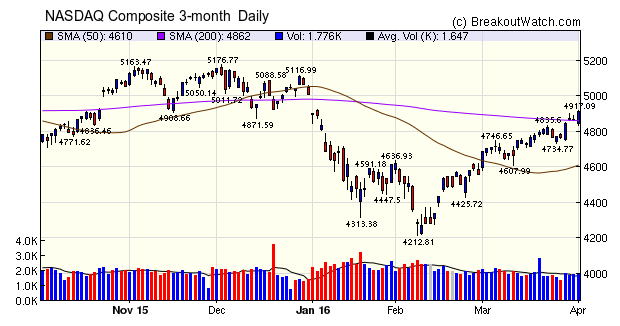
The NASDAQ Composite outperformed the two other major indexes with a
gain of 3% for the week and recorded three accumulation days
compared to only two for the DJI and S&P 500. Unlike the other
indexes, however, the index still lags for the year and remains in
negative territory. I expect this to change shortly as the index
broke through the psychological resistance level of its 50 day
moving average on Friday, after two earlier attempts in the week.
|
Weekly Breakout Report
|
Consistent with the usual pattern, Cup and handle stocks delivered
the most breakouts and the largest gains, with the exception of a
single Head and Shoulders Bottom breakout, DLNG.
Breakouts Summary by Watchlist for Week Beginning
03/28/16
| List |
Breakouts |
Avg. Gain |
| CwH |
13 |
2.84 |
| SQZ |
10 |
1.57 |
| HTF |
3 |
2.16 |
| HSB |
1 |
17.46 |
Breakouts Detail for Week Beginning 03/28/16
| Brkout Date |
Symbol |
Base |
Squeeze |
BrkoutOut Price |
Brkout Day Close |
RS Rank* |
Last Close |
Current % off BOP |
Gain at Intraday High |
| 03/31/16 |
DLNG |
HSB |
N |
9.68 |
11.39 |
25 |
11.37 |
17.46 |
18.23 |
| 03/31/16 |
PRMW |
CwH |
Y |
9.93 |
10.08 |
97 |
10.78 |
8.56 |
8.66 |
| 03/30/16 |
TROX |
HTF |
N |
6.34 |
6.64 |
66 |
6.84 |
7.89 |
8.04 |
| 03/30/16 |
SONC |
CwH |
N |
32.94 |
34.46 |
85 |
35.37 |
7.38 |
7.44 |
| 03/31/16 |
BETR |
CwH |
N |
13.92 |
14.29 |
95 |
14.81 |
6.39 |
6.39 |
| 03/30/16 |
KELYA |
SQZ |
Y |
18.17 |
18.61 |
89 |
19.2 |
5.67 |
5.78 |
| 03/30/16 |
LULU |
CwH |
N |
64.99 |
67.94 |
80 |
68.67 |
5.66 |
5.75 |
| 04/01/16 |
TBPH |
SQZ |
Y |
18.87 |
19.74 |
96 |
19.74 |
4.61 |
4.61 |
| 03/30/16 |
CYNO |
SQZ |
Y |
43.67 |
43.775 |
92 |
44.99 |
3.02 |
3.05 |
| 03/28/16 |
LAYN |
SQZ |
Y |
7.00 |
7.025 |
96 |
7.04 |
0.57 |
3 |
| 03/29/16 |
CVCO |
CwH |
N |
91.16 |
92.40 |
92 |
93.25 |
2.29 |
2.54 |
| 03/29/16 |
SSNI |
CwH |
N |
14.49 |
14.61 |
85 |
14.73 |
1.66 |
1.86 |
| 03/30/16 |
X |
HTF |
N |
16.26 |
16.48 |
97 |
16.46 |
1.23 |
1.78 |
| 03/28/16 |
PFO |
CwH |
N |
11.80 |
11.92 |
87 |
11.79 |
-0.08 |
1.61 |
| 03/29/16 |
LBRDK |
CwH |
N |
57.61 |
58.21 |
83 |
58.45 |
1.46 |
1.54 |
| 03/29/16 |
KANG |
CwH |
N |
21.70 |
21.70 |
92 |
22.01 |
1.43 |
1.47 |
| 03/30/16 |
CBNJ |
SQZ |
Y |
13.35 |
13.5 |
94 |
13.49 |
1.05 |
1.2 |
| 03/29/16 |
NAD |
SQZ |
Y |
14.75 |
14.75 |
81 |
14.89 |
0.95 |
0.95 |
| 04/01/16 |
ORI |
CwH |
Y |
18.31 |
18.47 |
86 |
18.47 |
0.87 |
0.93 |
| 03/30/16 |
OIA |
SQZ |
Y |
7.65 |
7.68 |
86 |
7.71 |
0.78 |
0.78 |
| 04/01/16 |
LKQ |
SQZ |
Y |
31.93 |
32.115 |
83 |
32.115 |
0.58 |
0.75 |
| 03/29/16 |
DCT |
CwH |
N |
39.77 |
40.02 |
88 |
39.92 |
0.38 |
0.65 |
| 03/31/16 |
SPB |
CwH |
N |
108.90 |
109.31 |
82 |
109.51 |
0.56 |
0.61 |
| 03/30/16 |
OLED |
CwH |
Y |
54.68 |
54.73 |
88 |
54.88 |
0.37 |
0.51 |
| 03/29/16 |
FR |
SQZ |
Y |
22.89 |
22.955 |
83 |
22.61 |
-1.22 |
0.48 |
| 03/31/16 |
DDD |
HTF |
N |
15.45 |
15.49 |
94 |
15.04 |
-2.65 |
0.32 |
| 03/31/16 |
PZE |
SQZ |
Y |
6.55 |
6.55 |
82 |
6.53 |
-0.31 |
0.31 |
| Weekly Average (27 breakouts) |
2.84 |
3.31 |
| *RS Rank on day before breakout. |
|
New Features This Week
I have dropped two components of the newsletter this week to make
way for a new feature which lists the 10 top rated stocks as
measured by our best performing criteria set out in our Revised
Rules for Trading Cup and Handle Breakouts.
You'll find this list as the last entry in the newsletter.
The two components I dropped were the top rated stocks and
best second chances based on my expected gain model. I dropped
them because after evaluating the expected gain model for 2015 to
date, I concluded that the model had no value.
|
Top Tip of the Week
Rare but Beautiful
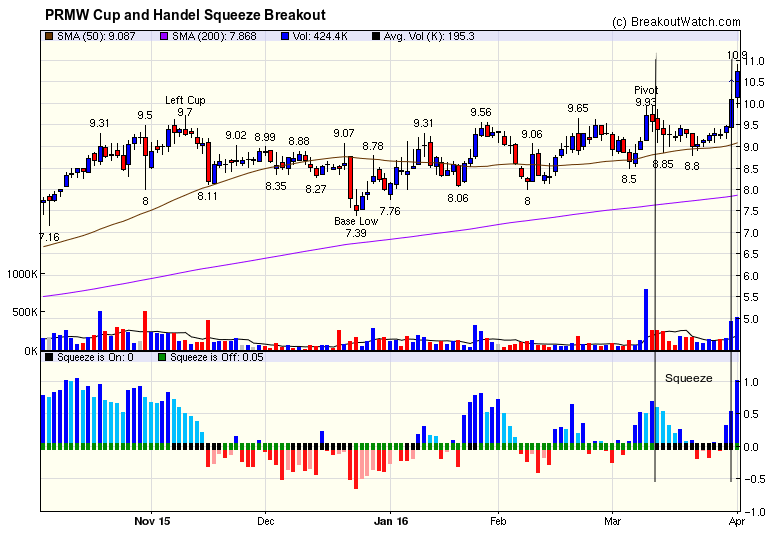
The best performing cup and handle stock for the week was PRMW which
had a well shaped handle and was coincidentally in a squeeze. The
combination of a handle squeeze and cup and handle pattern can
produce some of the most rewarding short term breakouts as I
showed in Breakouts
from a Cup and Handle Pattern with Volatility Squeeze Provide Best
Breakout Day Pop.
The handle squeeze is a comparatively rare situation, but is
usually rewarding.

|
Major Index Summary
| Index |
Value |
Change Week |
Change YTD |
Trend1 |
| Dow |
17792.8
|
2.11% |
2.11% |
Up
|
| NASDAQ |
4914.54
|
2.95% |
-1.85% |
Up
|
| S&P 500 |
2072.78
|
1.41% |
1.41% |
Up
|
1The Market Trend is derived from our
proprietary market model. The market model is described on the site.
2The site also shows industry rankings based on
fundamentals, combined technical and fundamentals, and on price
alone. The site also shows daily industry movements.
|
Best Performing Index
| 1 Week |
13 Weeks |
26 Weeks |
Year-to-Date |
NASDAQ Composite
3.1 % |
Dow Jones
3.75 % |
Dow Jones
8.02 % |
Dow Jones
2.11 % |
Best Performing Industry (by average technical score over each
period)
| 1 Week |
3 Weeks |
13 Weeks |
26 Weeks |
| Silver |
Silver |
Water Utilities |
Auto Parts Stores |
Most Improved Industry (by change in technical rank2)
| 1 Week |
3 Weeks |
13 Weeks |
26 Weeks |
| Electronics Wholesale + 54 |
Copper + 136 |
Silver + 186 |
Silver + 200 |
| Charts of each industry rank
and performance over 12 months are available on the site |
Top 10 Cup and Handle Stocks as of Friday April 1
| Symbol |
BO
Price |
BO
Vol. |
Company |
Industry |
RS
Rank |
Last
Close |
| USCR |
63.07 |
475,956 |
U S Concrete - Inc. |
General Building Materials |
97 |
61.82 |
| FIZZ |
43.80 |
168,670 |
National Beverage Corp. |
Beverages - Soft Drinks |
97 |
43.67 |
| LITE |
27.25 |
1,005,718 |
Lumentum Holdings Inc. |
Money Center Banks |
96 |
26.59 |
| SNC |
13.20 |
209,745 |
State National Companies - Inc. |
Property & Casualty Insurance |
96 |
12.71 |
| MGPI |
26.43 |
140,422 |
MGP Ingredients - Inc. |
Processed & Packaged Goods |
96 |
24.39 |
| PSAU |
18.52 |
56,148 |
PowerShares Global Gold & Precious Metals |
Closed-End Fund - Equity |
96 |
17.39 |
| TX |
18.76 |
538,275 |
Ternium S.A. |
Steel & Iron |
95 |
18.23 |
If you received this newsletter from a friend and you would like to
receive it regularly please go to the BreakoutWatch.com site and enter as
a Guest. You will then be able to register to receive the newsletter.
Copyright (c) 04/02/2016 NBIcharts, LLC dba BreakoutWatch.com. All rights
reserved.
" BreakoutWatch," the BreakoutWatch.com "eye" logo, and the slogan
"tomorrow's breakouts today" are service marks of NBIcharts LLC. All other
marks are the property of their respective owners, and are used for
descriptive purposes only.
BreakoutWatch is not affiliated with Investor's Business Daily or with
Mr. William O'Neil. Our site, research and analysis is supported entirely
by subscription and is free from advertising.

