Breakoutwatch Weekly Newsletter 04/10/16
You are receiving this email because you are or were a BreakoutWatch.com
subscriber, or have subscribed to our weekly newsletter. This newsletter
summarizes the breakout events of the week and provides additional
guidance that does not fit into our daily format. It is published each
weekend.
Weekly Commentary
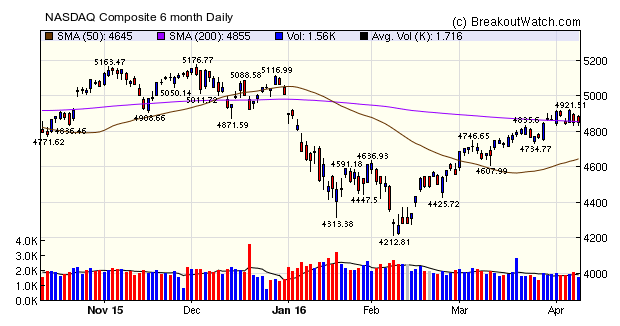
Although our market
trend indicators are still pointing up, I fear that we may soon see
a reversal. The NASDAQ Composite tested support at the 50 day
average level this week and although it did indeed find
support, the 50 day average line is itself trending down.
There were two distribution days, and only one accumulation day (on
Wednesday). Although the NASDAQ and other major indexes did close
modestly higher on Friday, they did so on low volume and each closed
the week with a more than 1% loss.
The Bureau of Economic Analysis will release its estimate of
first quarter GDP growth on April 28, but the Federal Reserve
Bank of Atlanta's GDPNow model predicts growth will only be at an
annualized rate of 0.1%. If this estimate proves accurate, it will
be a significant fall from the 4th quarter's 1.4% growth and will
likely move markets downward.
|
Weekly Breakout Report
The number of breakouts fell to just 16 this week. Although
the Volatility Squeeze pattern produced the majority, it was
Head and Shoulders Bottom pattern breakouts that produced the higher
average gains. |
Breakouts Summary by Watchlist for Week Beginning 04/04/16
| List |
Breakouts |
Avg. Gain |
| CwH |
4 |
2.65 |
| SQZ |
6 |
2.48 |
| HTF |
2 |
0.63 |
| HSB |
4 |
4.53 |
Breakouts Detail for Week Beginning 04/04/16
| Brkout Date |
Symbol |
Base |
Squeeze |
BrkoutOut Price |
Brkout Day Close |
RS Rank* |
Last Close |
Current % off BOP |
Gain at Intraday High |
| 04/04/16 |
MCRB |
HSB |
N |
27.73 |
28.32 |
23 |
30.98 |
11.72 |
13.6 |
| 04/06/16 |
CPXX |
HTF |
N |
12.73 |
13.03 |
99 |
12.9 |
1.34 |
8.09 |
| 04/04/16 |
TBPH |
SQZ |
Y |
19.75 |
20.36 |
97 |
20.98 |
6.23 |
6.23 |
| 04/07/16 |
ASA |
CwH |
N |
10.76 |
10.85 |
91 |
11.34 |
5.39 |
5.48 |
| 04/06/16 |
LYTS |
CwH |
N |
11.81 |
12.35 |
86 |
12.315 |
4.28 |
4.74 |
| 04/08/16 |
ASA |
SQZ |
Y |
10.86 |
11.34 |
94 |
11.34 |
4.42 |
4.51 |
| 04/04/16 |
TGS |
SQZ |
Y |
6.34 |
6.47 |
95 |
6.55 |
3.31 |
3.47 |
| 04/05/16 |
SPWH |
HSB |
N |
11.90 |
11.95 |
27 |
12.26 |
3.03 |
3.03 |
| 04/08/16 |
PFSW |
HSB |
N |
13.10 |
13.41 |
61 |
13.41 |
2.37 |
2.67 |
| 04/07/16 |
SHW |
SQZ |
Y |
290.78 |
292.38 |
86 |
297.085 |
2.17 |
2.23 |
| 04/06/16 |
NSAM |
HSB |
N |
11.84 |
11.87 |
22 |
11.96 |
1.01 |
1.01 |
| 04/06/16 |
CHD |
SQZ |
Y |
93.81 |
94.44 |
84 |
94.06 |
0.27 |
0.67 |
| 04/07/16 |
CAG |
CwH |
N |
45.84 |
46.07 |
83 |
46.045 |
0.45 |
0.65 |
| 04/05/16 |
FIX |
CwH |
N |
32.43 |
32.58 |
85 |
32.59 |
0.49 |
0.59 |
| 04/04/16 |
LKQ |
SQZ |
Y |
32.13 |
32.265 |
84 |
31.635 |
-1.54 |
0.5 |
| 04/04/16 |
CDORP |
HTF |
N |
12.05 |
12.06 |
99 |
12.04 |
-0.08 |
0.17 |
| Weekly Average (16 breakouts) |
2.8 |
3.6 |
| *RS Rank on day before breakout. |
12 Month Successful Breakout History
|
New Features This Week
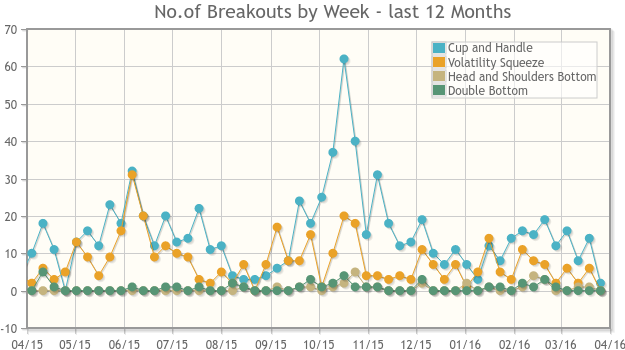
You will see above a chart of the number of breakouts per week over
the last twelve months. The purpose of the chart is to show two
things:
- the relative frequency of breakouts from each long position
pattern we follow
- the trend over recent weeks.
More discussion below.
|
Top Tip of the Week
Number
of Successful Breakouts Trending Down
The chart above shows that the frequency of breakouts from a cup and
handle pattern is higher than for the Volatility Squeeze pattern
which is higher than the Head and Shoulders bottom pattern. Double
Bottom breakouts are much less common.
While a high performing breakout can come from any pattern, as shown
by this week's HSB breakouts, this analysis suggests that when
looking for breakout candidates, one should focus on the Cup
and Handle and Volatility Squeeze patterns.
We can also see that the recent trend is for fewer successful
breakouts. This implies that a more conservative approach to trading
breakouts is suggested as there are likely to be fewer successes.
|
Top 10 Cup and Handle Stocks as of Friday April 08, 2016
| Symbol |
BO
Price |
BO
Vol. |
Company |
Industry |
RS
Rank |
Last
Close |
| CSC |
34.35 |
2,581,716 |
Computer Sciences Corporation |
Information Technology |
98 |
33.32 |
| USCR |
63.67 |
497,013 |
U S Concrete - Inc. |
General Building Materials |
98 |
62.44 |
| SBS |
6.80 |
3,397,618 |
Companhia de saneamento Basico Do Estado De Sao Pa |
Water Utilities |
97 |
6.53 |
| FIZZ |
45.30 |
170,805 |
National Beverage Corp. |
Beverages - Soft Drinks |
97 |
45.19 |
| ROCK |
28.75 |
364,196 |
Gibraltar Industries - Inc. |
Steel & Iron |
97 |
27.14 |
| PSAU |
18.52 |
59,280 |
PowerShares Global Gold & Precious Metals Portfoli |
Closed-End Fund - Equity |
96 |
18.39 |
| TX |
18.76 |
541,401 |
Ternium S.A. |
Steel & Iron |
96 |
18.47 |
| MFLX |
23.44 |
352,132 |
Multi-Fineline Electronix - Inc. |
Printed Circuit Boards |
95 |
23.35 |
| BYD |
21.25 |
2,323,719 |
Boyd Gaming Corporation |
Resorts & Casinos |
95 |
21.20 |
| FIX |
32.62 |
393,051 |
Comfort Systems USA - Inc. |
General Contractors |
95 |
32.59 |
Major Index Summary
| Index |
Value |
Change Week |
Change YTD |
Trend1 |
| Dow |
17577
|
-1.21% |
0.87% |
Up
|
| NASDAQ |
4850.69
|
-1.3% |
-3.13% |
Up
|
| S&P 500 |
2047.6
|
-1.21% |
0.18% |
Up
|
1The Market Trend is derived from our
proprietary market model. The market model is described on the site.
2The site also shows industry rankings based on
fundamentals, combined technical and fundamentals, and on price
alone. The site also shows daily industry movements.
|
Best Performing Index
| 1 Week |
13 Weeks |
26 Weeks |
Year-to-Date |
Dow Jones
-1.21 % |
Dow Jones
7.53 % |
Dow Jones
2.88 % |
Dow Jones
0.87 % |
Best Performing Industry (by average technical score over each
period)
| 1 Week |
3 Weeks |
13 Weeks |
26 Weeks |
| Silver |
Silver |
Water Utilities |
Auto Parts Stores |
Most Improved Industry (by change in technical rank2)
Music & Video Stores
+ 51 |
Consumer Services
+ 91 |
Silver
+ 170 |
Silver
+ 191 |
| Charts of each industry rank
and performance over 12 months are available on the site |
If you received this newsletter from a friend and you would like to
receive it regularly please go to the BreakoutWatch.com site and enter as
a Guest. You will then be able to register to receive the newsletter.
Copyright (c) 04/10/2016 NBIcharts, LLC dba BreakoutWatch.com. All rights
reserved.
" BreakoutWatch," the BreakoutWatch.com "eye" logo, and the slogan
"tomorrow's breakouts today" are service marks of NBIcharts LLC. All other
marks are the property of their respective owners, and are used for
descriptive purposes only.
BreakoutWatch is not affiliated with Investor's Business Daily or with
Mr. William O'Neil. Our site, research and analysis is supported entirely
by subscription and is free from advertising.