Breakoutwatch Weekly Newsletter 04/30/16
You are receiving this email because you are or were a BreakoutWatch.com
subscriber, or have subscribed to our weekly newsletter. This newsletter
summarizes the breakout events of the week and provides additional
guidance that does not fit into our daily format. It is published each
weekend.
Weekly Commentary
Our market trend indicators for the three major indexes
turned south on Thursday as investors became wary of slowing
economic growth and AAPL, GOOGL and MSFT missed earnings
estimates. With all three major indexes trending down, this is a
risky time to consider opening long positions.
The NASDAQ looks particularly grim with 4 distribution days
in the last week as our equivolume chart for the NASDAQ
shows.
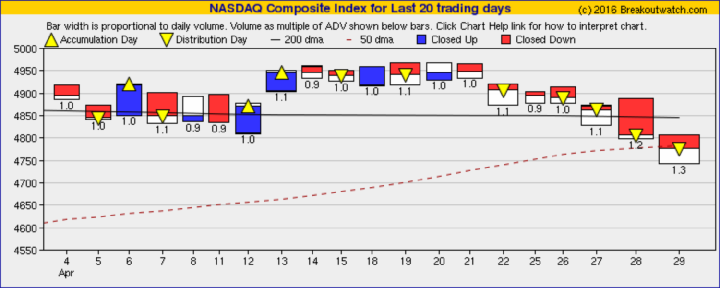
You can see that volumes (width of the bars relative to the 50 day
average volume) were progressively higher ending with a 30%
increase over the 50 DMA on Friday. Note also that the index
closed just below its 200 day average.
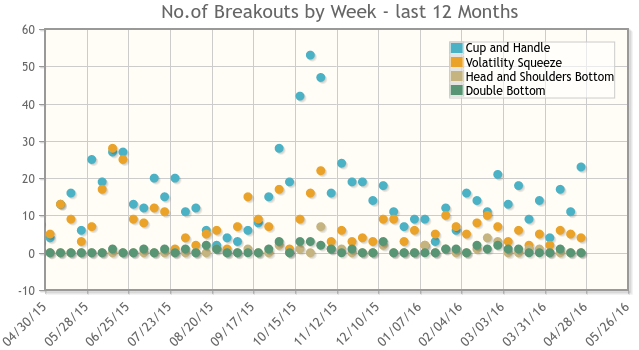
Despite the downward trend, there was a surprising uptick in the
number of cup and handle breakouts to 24 compared to just 11 last
week while Volatility Squeeze breakouts fell from 16 to 11.
|
Breakouts Summary by Watchlist for Week Beginning 04/25/16
| List |
Breakouts |
Avg. Gain |
| CWH |
23 |
2.93 |
| SQZ |
4 |
3.33 |
| HTF |
2 |
4.24 |
| HSB |
0
|
0 |
| DB |
0
|
0 |
Breakouts Detail for Week Beginning 04/25/16
| Brkout Date |
Symbol |
Base |
Squeeze |
BrkoutOut Price |
Brkout Day Close |
RS Rank* |
Last Close |
Current % off BOP |
Gain at Intraday High |
| 2016-04-29 |
SKYW |
CWH |
n |
21.14 |
24 |
94 |
23.5 |
11.16% |
16.56% |
| 2016-04-26 |
AMSC |
CWH |
n |
9.05 |
10 |
97 |
9.96 |
10.06% |
12.15% |
| 2016-04-28 |
HEES |
CWH |
y |
18.81 |
19 |
86 |
20.23 |
7.55% |
10.15% |
| 2016-04-28 |
NEFF |
CWH |
y |
7.95 |
9 |
80 |
8.55 |
7.55% |
15.09% |
| 2016-04-26 |
ETH |
CWH |
y |
31.92 |
34 |
85 |
34.04 |
6.64% |
10.62% |
| 2016-04-29 |
BOOM |
CWH |
n |
9.18 |
10 |
81 |
9.77 |
6.43% |
7.41% |
| 2016-04-28 |
MDVN |
CWH |
n |
54.55 |
56 |
86 |
57.8 |
5.96% |
9.84% |
| 2016-04-27 |
NS |
CWH |
n |
47.68 |
49 |
83 |
50.44 |
5.79% |
5.91% |
| 2016-04-29 |
HEES |
SQZ |
y |
19.16 |
20 |
94 |
20.23 |
5.58% |
8.14% |
| 2016-04-29 |
CDE |
HTF |
n |
7.68 |
8 |
99 |
8.1 |
5.47% |
5.99% |
| 2016-04-26 |
SLCA |
SQZ |
y |
24.28 |
25 |
91 |
25.55 |
5.23% |
12.27% |
| 2016-04-26 |
CYNO |
CWH |
y |
46.60 |
50 |
92 |
48.94 |
5.02% |
10.71% |
| 2016-04-27 |
AA |
CWH |
n |
10.74 |
11 |
89 |
11.17 |
4% |
7.08% |
| 2016-04-29 |
GGN |
CWH |
n |
6.83 |
7 |
95 |
7.09 |
3.81% |
4.25% |
| 2016-04-28 |
SWC |
CWH |
n |
11.80 |
12 |
95 |
12.2 |
3.39% |
8.81% |
| 2016-04-26 |
CWCO |
CWH |
n |
13.48 |
14 |
82 |
13.89 |
3.04% |
3.04% |
| 2016-04-29 |
AG |
HTF |
n |
10.33 |
11 |
99 |
10.64 |
3% |
3.78% |
| 2016-04-26 |
MWA |
CWH |
n |
10.55 |
11 |
87 |
10.75 |
1.9% |
5.5% |
| 2016-04-27 |
SLCA |
SQZ |
y |
25.14 |
27 |
92 |
25.55 |
1.63% |
8.43% |
| 2016-04-29 |
GIMO |
CWH |
n |
32.22 |
33 |
83 |
32.59 |
1.15% |
8.69% |
| 2016-04-29 |
LANC |
SQZ |
y |
115.48 |
117 |
87 |
116.5 |
0.88% |
2.61% |
| 2016-04-27 |
TTI |
CWH |
n |
7.16 |
7 |
87 |
7.2 |
0.56% |
8.24% |
| 2016-04-27 |
MTZ |
CWH |
n |
22.54 |
23 |
95 |
22.66 |
0.53% |
5.94% |
| 2016-04-26 |
OMN |
CWH |
n |
7.15 |
7 |
82 |
7.15 |
0% |
4.9% |
| 2016-04-27 |
GRMN |
CWH |
n |
43.17 |
44 |
81 |
42.63 |
-1.25% |
2.9% |
| 2016-04-28 |
AVD |
CWH |
n |
16.84 |
17 |
95 |
16.55 |
-1.72% |
3.38% |
| 2016-04-26 |
COH |
CWH |
n |
41.45 |
42 |
92 |
40.27 |
-2.85% |
1.64% |
| 2016-04-26 |
SINA |
CWH |
n |
51.68 |
52 |
80 |
50.09 |
-3.08% |
0.23% |
| 2016-04-26 |
IIVI |
CWH |
n |
22.72 |
23 |
89 |
20.87 |
-8.14% |
2.95% |
| *RS Rank on day before breakout. |
12 Month Successful Breakout History
|
New Features This Week
No new features this week.
|
Top Tip of the Week
|
Curb your enthusiasm and be wary of opening new long positions.
|
Top 10 Cup and Handle Stocks as of Wednesday April 20, 2016
| Symbol |
BO
Price |
BO
Vol. |
Company |
Industry |
RS
Rank |
Last
Close |
| ASA |
12.75 |
300,663 |
ASA Gold and Precious Metals Limited |
Asset Management |
97 |
12.16 |
| AVNU |
20.54 |
62,079 |
Avenue Financial Holdings - Inc. |
Regional - Southeast Banks |
97 |
20.35 |
| INO |
10.08 |
2,582,032 |
Inovio Pharmaceuticals - Inc. |
Biotechnology |
97 |
9.74 |
| CSC |
34.39 |
2,395,830 |
Computer Sciences Corporation |
Information Technology |
97 |
33.16 |
| LXRX |
14.46 |
1,120,389 |
Lexicon Pharmaceuticals - Inc. |
Biotechnology |
96 |
13.71 |
| NHTC |
38.50 |
507,066 |
Natural Health Trends Corp. |
Personal Products |
96 |
34.90 |
| BUFF |
25.98 |
1,602,381 |
Blue Buffalo Pet Products - Inc. |
Food - Major Diversified |
96 |
24.90 |
| FIZZ |
47.00 |
152,744 |
National Beverage Corp. |
Beverages - Soft Drinks |
95 |
43.33 |
| MSG |
170.01 |
214,252 |
MSG Networks Inc. |
Entertainment - Diversified |
95 |
159.76 |
| ROCK |
28.75 |
351,741 |
Gibraltar Industries - Inc. |
Steel & Iron |
95 |
27.95 |
Major Index Summary
| Index |
Value |
Change Week |
Change YTD |
Trend1 |
| Dow |
17773.6
|
-1.28% |
2% |
Down
|
| NASDAQ |
4775.36
|
-2.67% |
-4.63% |
Down
|
| S&P 500 |
2065.3
|
-1.26% |
1.05% |
Down
|
1The Market Trend is derived from
our proprietary market model. The market model is described on
the site.
2The site also shows industry rankings based on
fundamentals, combined technical and fundamentals, and on price
alone. The site also shows daily industry movements.
|
Best Performing Index
| 1 Week |
13 Weeks |
26 Weeks |
Year-to-Date |
S&P 500
-1.26 % |
Dow Jones
7.94 % |
Dow Jones
0.62 % |
Dow Jones
2 % |
Best Performing Industry (by average technical score over each
period)
| 1 Week |
3 Weeks |
13 Weeks |
26 Weeks |
| Silver |
Silver |
Water Utilities |
REIT - Industrial |
Most Improved Industry (by change in technical rank2)
Trucks & Other Vehicles
+ 92 |
Trucks & Other Vehicles
+ 117 |
Copper
+ 191 |
Gold
+ 191 |
| Charts of each industry
rank and performance over 12 months are available on the site |
If you received this newsletter from a friend and you would like to
receive it regularly please go to the BreakoutWatch.com site and enter as
a Guest. You will then be able to register to receive the newsletter.
Copyright (c) 04/30/2016 NBIcharts, LLC dba BreakoutWatch.com. All rights
reserved.
" BreakoutWatch," the BreakoutWatch.com "eye" logo, and the slogan
"tomorrow's breakouts today" are service marks of NBIcharts LLC. All other
marks are the property of their respective owners, and are used for
descriptive purposes only.
BreakoutWatch is not affiliated with Investor's Business Daily or with
Mr. William O'Neil. Our site, research and analysis is supported entirely
by subscription and is free from advertising.