Breakoutwatch Weekly Summary 08/13/16

You are receiving this email because you are or were a BreakoutWatch.com subscriber, or have subscribed to our weekly newsletter. This newsletter summarizes the breakout events of the week and provides additional guidance that does not fit into our daily format. It is published each weekend.

Contents
New Features this Week
Strategy Suggestions
Breakouts Summary
Breakouts Detail
Top Cup and Handle Chart Pattern Stocks
Breakouts Index
Major Indexes Performance
Best Performing Index
Best Performing Industry
Most Improved Industry

Weekly Commentary

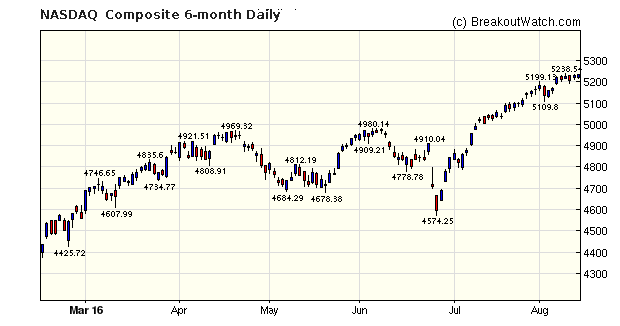
The recent strong rise in the markets appears to be leveling off as the NASDAQ Chart shows. Some 
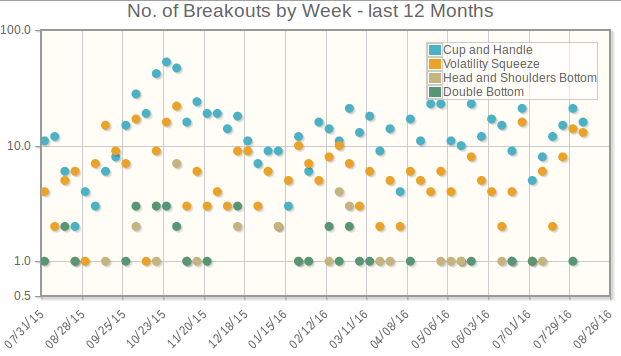
consolidation is to be expected and we will likely see an increase in the number of cup and handle chart patterns as handles form and also Volatility Squeeze patterns as volatility falls.

NASDAQ Chart
New Features this Week

A 30  day trial of Breakoutwatch.com is now FREE

Go to http://www.breakoutwatch.com and choose "Test Drive" from the top menu bar.
Strategy Suggestions
Our latest strategy suggestions are here.
Breakouts Summary by Watchlist for Week Beginning 08/08/16
Strong markets delivering new highs for the three major indexes (on Thursday) produced 29 breakouts this week. The Volatility Squeeze chart pattern produced the best returns as stocks that had been marking time responded to the strong upward trend. The table below shows exceptionally strong gains were available.
List Breakouts Avg. Gain
CWH 16 3.69
SQZ 13 5.39
HTF
0
HSB
0
DB
0
Breakouts Detail for Week Beginning 08/08/16
Brkout Date Symbol Base Squeeze BrkoutOut Price Brkout Day Close RS Rank* Last Close Current % off BOP Gain at Intraday High
2016-08-10 AOSL SQZ y 14.87 15 92 19.63 32.01% 32.01%
2016-08-09 CC CWH y 9.78 10 85 11.45 17.08% 23.82%
2016-08-10 XONE CWH n 11.70 13 82 13.47 15.13% 19.66%
2016-08-09 DTSI SQZ y 29.13 33 81 32.6 11.91% 17.71%
2016-08-09 CECE CWH y 9.49 10 84 10.33 8.85% 10.01%
2016-08-09 ECA SQZ y 8.73 9 93 9.39 7.56% 9.28%
2016-08-11 VRTV SQZ y 45.00 48 84 48.34 7.42% 9.76%
2016-08-11 BZUN CWH n 8.79 9 91 9.43 7.28% 9.67%
2016-08-09 CDZI CWH y 7.38 7 88 7.8 5.69% 8.4%
2016-08-10 CDZI SQZ y 7.40 8 91 7.8 5.41% 8.11%
2016-08-10 CECE SQZ y 9.82 10 89 10.33 5.19% 5.5%
2016-08-09 SN SQZ y 7.75 8 91 8.13 4.9% 6.71%
2016-08-11 CCLP CWH y 9.09 9 81 9.5 4.51% 4.51%
2016-08-11 YNDX SQZ y 22.37 23 92 23.21 3.76% 5.23%
2016-08-11 OEC CWH n 17.40 18 80 18.01 3.51% 4.66%
2016-08-11 MDVN SQZ y 64.00 66 92 66.02 3.16% 3.42%
2016-08-08 CIA CWH n 9.27 10 85 9.55 3.02% 7.01%
2016-08-10 ORN CWH n 6.26 6 88 6.44 2.88% 3.99%
2016-08-08 DTLK CWH n 9.69 10 87 9.96 2.79% 4.85%
2016-08-12 CCLP SQZ y 9.26 10 85 9.5 2.59% 2.59%
2016-08-12 ATEN CWH n 8.00 8 80 8.19 2.37% 2.37%
2016-08-09 AMPH CWH n 17.80 18 87 18.1 1.69% 5.56%
2016-08-09 DTLK CWH n 9.82 10 87 9.96 1.43% 3.46%
2016-08-10 BGFV CWH n 12.95 13 81 13.05 0.77% 2.32%
2016-08-08 PCTY SQZ y 47.26 47 88 45.54 -3.64% 5.06%
2016-08-08 MB SQZ y 18.26 19 92 17.45 -4.44% 5.81%
2016-08-08 ITCI SQZ y 42.73 43 88 40.29 -5.71% 3.02%
2016-08-08 DQ CWH n 25.45 26 87 23.4 -8.06% 8.45%
2016-08-08 TCX CWH n 30.49 32 83 27.47 -9.9% 5.05%
*RS Rank on day before breakout.
12 Month Successful Breakout History
This chart allows you to see how the frequency of this week's breakouts compare to the last year. Note that the trend has been upwards for the last 4-5 weeks.
breakouts
Top Rated Cup and Handle Stocks as of Friday August 12, 2016
Symbol BO
Price
BO
Vol.
Company Industry RS
Rank
Last
Close
COT 17.09 1,506,520 Cott Corporation Beverages - Soft Drinks 94 16.91
TTMI 10.70 1,214,040 TTM Technologies - Inc. Printed Circuit Boards 94 10.25
OFG 11.25 679,227 OFG Bancorp Money Center Banks 92 10.60
These stocks meet our suggested screening factors for our Cup and Handle Chart Pattern watchlist. As of Friday, there were just three meeting the tests.
See Revised Rules for Trading Cup and Handle Breakouts
Major Index Summary
Index Value Change Week Change YTD Trend1
Dow 18576.5
0.18% 6.61% Up
NASDAQ 5232.9
0.23% 4.5% Up
S&P 500 2184.05
0.05% 6.85% Up
1The Market Trend is derived from our proprietary market model. The market model is described on the sitehere.
2The site also shows industry rankings based on fundamentals, combined technical and fundamentals, and on price alone. The site also shows daily industry movements.
Best Performing Index
1 Week 13 Weeks 26 Weeks Year-to-Date
NASDAQ Composite
0.23 %
NASDAQ Composite
10.92 %
NASDAQ Composite
20.64 %
S&P 500
6.85 %
Best Performing Industry (by average technical score over each period)
1 Week 3 Weeks 13 Weeks 26 Weeks
Silver Silver Silver Silver
Most Improved Industry (by change in technical rank2)
Manufactured Housing
+ 212
Basic Materials Wholesale
+ 116
Manufactured Housing
+ 212
Manufactured Housing
+ 212
Charts of each industry rank and performance over 12 months are available on the site


If you received this newsletter from a friend and you would like to receive it regularly please go to the BreakoutWatch.com site and you will then be able to register to receive the newsletter.

Copyright (c) 08/13/2016 NBIcharts, LLC dba BreakoutWatch.com. All rights reserved.
" BreakoutWatch," the BreakoutWatch.com "eye" logo, and the slogan "tomorrow's breakouts today" are service marks of NBIcharts LLC. All other marks are the property of their respective owners, and are used for descriptive purposes only.

BreakoutWatch is not affiliated with Investor's Business Daily or with Mr. William O'Neil. Our site, research and analysis is supported entirely by subscription and is free from advertising.