Breakoutwatch Weekly Summary 10/08/16
You are receiving this email because you are or were a BreakoutWatch.com subscriber, or have subscribed to our weekly newsletter. This newsletter summarizes the breakout events of the week and provides additional guidance that does not fit into our daily format. It is published each weekend.
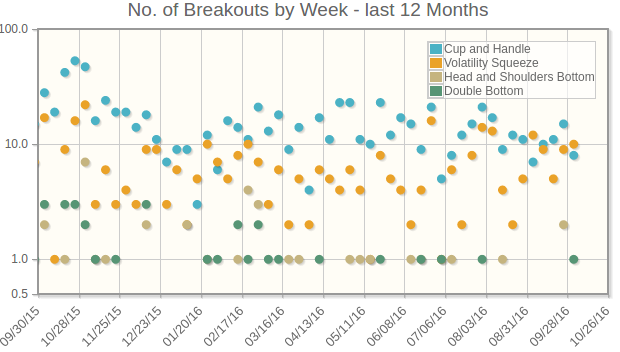
The major indexes traded within a narrow range with a slight negative bias. The NASDAQ Composite index lost 0.4% in a week when volumes were below average. The NASDAQ Composite closed higher on only one day this week but our trend indicator remains positive for the NASDAQ as it does for the S&P 500 and DJI. Lower volumes contributed to a drop in the number of breakouts this week from 26 to 20. The jobs report showed an increase in the participation rate which indicates growing optimism among potential job seekers. This increases the likelihood of a Fed rate increase in December and a decline in equity prices will likely follow. In the meantime, earnings reports kick-off on Tuesday and will effect the short term direction of trading. 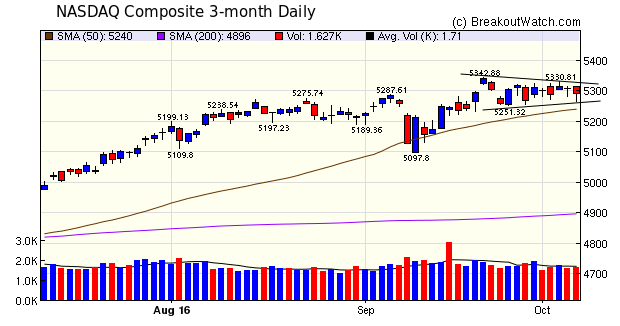 |
| No new features this week.
|
| List | Breakouts | Avg. Gain |
|---|---|---|
| CWH | 8 | 2.91 |
| SQZ | 10 | 1.5 |
| HTF | 1 | 7.02 |
| HSB | 0 | |
| DB | 1 | -2.46 |
| Brkout Date | Symbol | Base | Squeeze | BrkoutOut Price | Brkout Day Close | RS Rank* | Last Close | Current % off BOP | Gain at Intraday High |
|---|---|---|---|---|---|---|---|---|---|
| 2016-10-05 | EPM | CWH | n | 6.85 | 8 | 88 | 7.4 | 8.03% | 13.43% |
| 2016-10-06 | BGFV | CWH | n | 14.64 | 15 | 92 | 15.74 | 7.51% | 8.61% |
| 2016-10-03 | BZUN | HTF | n | 15.96 | 16 | 99 | 17.08 | 7.02% | 11.28% |
| 2016-10-03 | EDN | CWH | y | 19.92 | 20 | 82 | 21.12 | 6.02% | 7.93% |
| 2016-10-04 | PGNX | SQZ | y | 6.78 | 7 | 90 | 7.02 | 3.54% | 14.31% |
| 2016-10-05 | NSTG | CWH | n | 20.28 | 21 | 87 | 20.99 | 3.5% | 5.67% |
| 2016-10-06 | VRTV | SQZ | y | 50.25 | 51 | 87 | 51.61 | 2.71% | 3.22% |
| 2016-10-06 | IBKC | SQZ | y | 69.28 | 70 | 84 | 70.72 | 2.08% | 2.19% |
| 2016-10-04 | DLNG | SQZ | y | 15.64 | 16 | 91 | 15.92 | 1.79% | 3.9% |
| 2016-10-05 | SBSI | SQZ | y | 32.17 | 33 | 84 | 32.63 | 1.43% | 2.36% |
| 2016-10-06 | RTEC | SQZ | y | 17.89 | 18 | 87 | 18.12 | 1.29% | 2.29% |
| 2016-10-06 | UCTT | CWH | n | 7.63 | 8 | 90 | 7.72 | 1.18% | 3.01% |
| 2016-10-06 | IBTX | SQZ | y | 43.80 | 44 | 85 | 44.31 | 1.16% | 1.39% |
| 2016-10-04 | ARCX | SQZ | y | 15.61 | 16 | 90 | 15.78 | 1.09% | 2.18% |
| 2016-10-06 | TSEM | CWH | y | 16.13 | 16 | 82 | 16.17 | 0.25% | 0.81% |
| 2016-10-05 | ARCX | SQZ | y | 15.76 | 16 | 90 | 15.78 | 0.13% | 1.21% |
| 2016-10-05 | DLNG | SQZ | y | 15.95 | 16 | 93 | 15.92 | -0.19% | 1.88% |
| 2016-10-06 | NANO | CWH | n | 22.52 | 23 | 90 | 22.21 | -1.38% | 4.84% |
| 2016-10-05 | PAA | CWH | n | 31.72 | 32 | 85 | 31.13 | -1.86% | 0.38% |
| 2016-10-05 | GPN | DB | n | 77.93 | 79 | 76 | 76.01 | -2.46% | 1.68% |
| *RS Rank on day before breakout. | |||||||||
 |
| Symbol | BO Price |
BO Vol. |
Company | Industry | RS Rank |
Last Close |
|---|---|---|---|---|---|---|
| NRP | 30.50 | 212,096 | Natural Resource Partners LP | Industrial Metals & Minerals | 99 | 29.00 |
| USDP | 13.35 | 48,468 | USD Partners LP | Railroads | 96 | 13.22 |
| ENBL | 16.39 | 318,190 | Enable Midstream Partners - LP | Oil & Gas Pipelines | 95 | 15.66 |
| MGPI | 42.98 | 299,595 | MGP Ingredients - Inc. | Processed & Packaged Goods | 95 | 41.43 |
| ARLP | 22.65 | 413,966 | Alliance Resource Partners - L.P. | Industrial Metals & Minerals | 94 | 22.29 |
| HSC | 10.40 | 931,090 | Harsco Corporation | Industrial Metals & Minerals | 92 | 9.93 |
| CGNX | 53.46 | 607,454 | Cognex Corporation | Scientific & Technical Instruments | 92 | 51.89 |
| These stocks meet our suggested screening factors
for our Cup and Handle Chart Pattern watchlist. See Revised Rules for Trading Cup and Handle Breakouts |
||||||
| Index | Value | Change Week | Change YTD | Trend1 |
|---|---|---|---|---|
| Dow | 18240.5 |
-0.37% | 4.68% | Up |
| NASDAQ | 5292.4 |
-0.37% | 5.69% | Up |
| S&P 500 | 2153.74 |
-0.67% | 5.37% | Up |
|
1The Market Trend is derived from
our proprietary market model. The market model is described on
the sitehere.
2The site also shows industry rankings based on fundamentals, combined technical and fundamentals, and on price alone. The site also shows daily industry movements. |
||||
| 1 Week | 13 Weeks | 26 Weeks | Year-to-Date |
|---|---|---|---|
| Dow Jones |
NASDAQ Composite 6.77 % |
NASDAQ Composite 9.11 % |
NASDAQ Composite 5.69 % |
| 1 Week | 3 Weeks | 13 Weeks | 26 Weeks |
|---|---|---|---|
| Manufactured Housing |
Manufactured Housing |
Silver |
Silver |
| Life Insurance 61 |
Drug Related Products 119 |
Manufactured Housing 213 |
Manufactured Housing 213 |
| Charts of each industry rank and performance over 12 months are available on the site | |||
If you received this newsletter from a friend and you would like to receive it regularly please go to the BreakoutWatch.com site and you will then be able to register to receive the newsletter.
Copyright (c) 10/08/2016 NBIcharts, LLC dba BreakoutWatch.com. All
rights reserved.
" BreakoutWatch," the BreakoutWatch.com "eye" logo, and the slogan
"tomorrow's breakouts today" are service marks of NBIcharts LLC. All
other marks are the property of their respective owners, and are used
for descriptive purposes only.
BreakoutWatch is not affiliated with Investor's Business Daily or with Mr. William O'Neil. Our site, research and analysis is supported entirely by subscription and is free from advertising.