Breakoutwatch Weekly Summary 01/21/17
You are receiving this email because you are or were a BreakoutWatch.com subscriber, or have subscribed to our weekly newsletter. This newsletter summarizes the breakout events of the week and provides additional guidance that does not fit into our daily format. It is published each weekend.
| The major indexes fell slightly this
week with the NASDAQ Composite under performing despite, or
because of, its early strength so far this year. Volumes
were at or below the 50 day average limiting the number of
breakouts to just seven this week although two of them, SALT and
EMES, were very strong with gains of over 20%. Both of these had
very high Relative Strength ranks, 94 and 98 respectively,
before breakout which is consistent with my research since
beginning this site, that high RS rank is the most
significant metric for producing strong gains on breakout. I've
recently completed an analysis of what worked in 2016 and that
conclusion was again confirmed and I have revised my
suggested trading strategy accordingly. See my Strategy
Suggestions below. The NASDAQ has gained 11% since the election so a period of consolidation is unsurprising. We can expect that to continue partly due to the recent rapid rise but also because there is now some uncertainty as to what the Trump economy will actually bring. 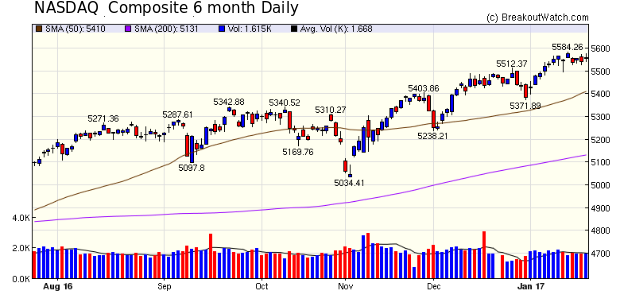 |
| List | Breakouts | Avg. Gain |
|---|---|---|
| CWH | 3 | 9.18 |
| SQZ | 3 | 8.95 |
| HTF | 1 | 0.24 |
| HSB | 0 | |
| DB | 0 |
| Brkout Date | Symbol | Base | Squeeze | BrkoutOut Price | Brkout Day Close | RS Rank* | Last Close | Current % off BOP | Gain at Intraday High |
|---|---|---|---|---|---|---|---|---|---|
| 2017-01-18 | SALT | CWH | n | 6.30 | 7 | 96 | 7.55 | 19.84% | 24.29% |
| 2017-01-18 | EMES | SQZ | y | 13.46 | 14 | 98 | 15.88 | 17.98% | 22.88% |
| 2017-01-20 | NVEE | SQZ | y | 36.16 | 39 | 89 | 38.6 | 6.75% | 7.85% |
| 2017-01-18 | BPI | CWH | n | 10.86 | 11 | 88 | 11.49 | 5.8% | 6.63% |
| 2017-01-20 | IIVI | SQZ | y | 30.21 | 31 | 88 | 30.85 | 2.12% | 3.28% |
| 2017-01-19 | VCRA | CWH | n | 20.00 | 20 | 84 | 20.38 | 1.9% | 6.15% |
| 2017-01-20 | HIIQ | HTF | n | 20.65 | 21 | 99 | 20.7 | 0.24% | 1.69% |
| *RS Rank on day before breakout. | |||||||||
| No new features this week. |
|
Over last week's long weekend I conducted an analysis of the metrics that produced the strongest returns during 2016. That produced a significant update to my strategy suggestions for trading cup and handle pattern stocks which are now described here. The most important result is that I've revised upwards my suggested minimum RS rank from 92 to 94. The new strategy could have returned profits of well over 100% during 2016 but of course there is no guarantee that will be repeated during 2017. Nevertheless, without a crystal ball, history is all we have to go on when planning for the future.The chart below shows how the strategy could have performed during 2016 using our cup and handle backtest tool. Note this chart does not allow for brokerage fees or slippage, although you factor these into the backtest if you run it for yourself. 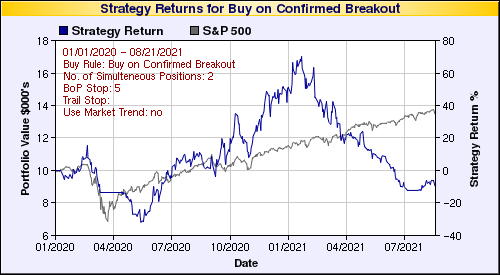 |
| Symbol | BO Price |
BO Vol. |
Company | Industry | RS Rank |
Last Close |
|---|---|---|---|---|---|---|
| AXTI | 6.20 | 386,104 | AXT Inc | Semiconductor - Integrated Circuits | 96 | 6.03 |
| PBR | 11.71 | 34,686,129 | Petroleo Brasileiro S.A.- Petrobras | Oil & Gas Drilling & Exploration | 96 | 11.20 |
| BVN | 13.55 | 2,667,333 | Buenaventura Mining Company Inc. | Industrial Metals & Minerals | 95 | 13.15 |
| ETE | 20.05 | 10,563,930 | Energy Transfer Equity - L.P. | Oil & Gas Pipelines | 94 | 18.00 |
| TPC | 29.70 | 1,008,388 | Tutor Perini Corporation | Heavy Construction | 94 | 27.80 |
| SPAR | 9.80 | 175,642 | Spartan Motors - Inc. | Trucks & Other Vehicles | 93 | 8.30 |
| KMT | 36.12 | 1,557,448 | Kennametal Inc. | Machine Tools & Accessories | 92 | 34.69 |
| These stocks meet our suggested screening factors
for our Cup and Handle Chart Pattern watchlist. See new suggestions for trading cup and handle Breakouts |
||||||
| Index | Value | Change Week | Change YTD | Trend1 |
|---|---|---|---|---|
| Dow | 19827.2 |
-0.29% | 0.33% | Up |
| NASDAQ | 5555.33 |
-0.34% | 3.2% | Up |
| S&P 500 | 2271.31 |
-0.15% | 1.45% | Up |
|
1The Market Trend is derived from
our proprietary market model. The market model is described on
the sitehere.
2The site also shows industry rankings based on fundamentals, combined technical and fundamentals, and on price alone. The site also shows daily industry movements. |
||||
| 1 Week | 13 Weeks | 26 Weeks | Year-to-Date |
|---|---|---|---|
| S&P 500 |
Dow Jones 5.67 % |
NASDAQ Composite 8.92 % |
NASDAQ Composite 3.2 % |
| 1 Week | 3 Weeks | 13 Weeks | 26 Weeks |
|---|---|---|---|
| Basic Materials Wholesale |
Basic Materials Wholesale |
Regional - Southwest Banks |
Manufactured Housing |
| Music & Video Stores 43 |
Silver 73 |
Long Distance Carriers 202 |
Basic Materials Wholesale 213 |
| Charts of each industry rank and performance over 12 months are available on the site | |||
If you received this newsletter from a friend and you would like to receive it regularly please go to the BreakoutWatch.com site and you will then be able to register to receive the newsletter.
Copyright (c) 01/21/2017 NBIcharts, LLC dba BreakoutWatch.com. All
rights reserved.
" BreakoutWatch," the BreakoutWatch.com "eye" logo, and the slogan
"tomorrow's breakouts today" are service marks of NBIcharts LLC. All
other marks are the property of their respective owners, and are used
for descriptive purposes only.
BreakoutWatch is not affiliated with Investor's Business Daily or with Mr. William O'Neil. Our site, research and analysis is supported entirely by subscription and is free from advertising.