Breakoutwatch Weekly Summary 02/11/17
You are receiving this email because you are or were a BreakoutWatch.com subscriber, or have subscribed to our weekly newsletter. This newsletter summarizes the breakout events of the week and provides additional guidance that does not fit into our daily format. It is published each weekend.
| The NASDAQ Composite led the three
major indexes to new highs this week with a gain of 1.2%. The
index has gained 6.5% year to date, almost double that of the
S&P 500. Most breakouts come from NASDAQ listed stocks, which
is why we follow it each week. Action on Thursday and Friday took
the index above the medium term trend of daily highs, but Friday's
'Doji' candlestick, resulting from an afternoon pull-back, showed
that traders feared that the market was getting ahead of itself.
Nevertheless, the index closed at a new high. The number of breakouts jumped to 27 from 16 last week. Subscribers and regular readers know that our suggested trading strategy is to focus on stocks with an RS Rank of at least 94. If you look at our table of the week's breakouts below, you will see that stocks with an RS Rank of at least 94 filled the top three slots and 8 out of the top 10. See our table of top ranked stocks below for stocks that met the RS Rank requirement as of Friday's close. 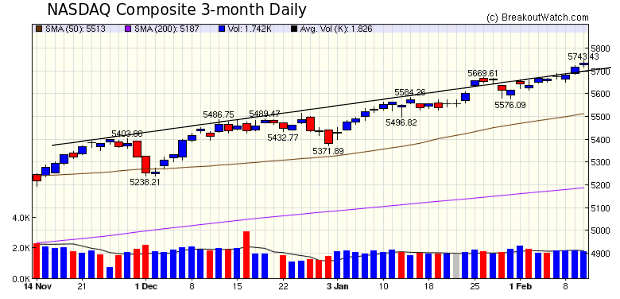 |
| No new features this week. |
| List | Breakouts | Avg. Gain |
|---|---|---|
| CWH | 12 | 3.4 |
| SQZ | 13 | 4.61 |
| HTF | 0 | |
| HSB | 0 | |
| DB | 2 | 1.94 |
| Brkout Date | Symbol | Base | Squeeze | BrkoutOut Price | Brkout Day Close | RS Rank* | Last Close | Current % off BOP | Gain at Intraday High |
|---|---|---|---|---|---|---|---|---|---|
| 2017-02-09 | CLF | SQZ | y | 9.53 | 11 | 98 | 11.15 | 17% | 22.77% |
| 2017-02-10 | EVI | SQZ | y | 15.81 | 18 | 99 | 17.8 | 12.59% | 16.7% |
| 2017-02-06 | PCMI | CWH | y | 24.30 | 25 | 96 | 26.95 | 10.91% | 11.93% |
| 2017-02-06 | LOB | CWH | n | 20.90 | 22 | 84 | 23.1 | 10.53% | 11.72% |
| 2017-02-08 | TTMI | CWH | n | 15.38 | 16 | 95 | 16.75 | 8.91% | 12.29% |
| 2017-02-09 | X | SQZ | y | 34.54 | 37 | 98 | 37.6 | 8.86% | 10.63% |
| 2017-02-07 | GWPH | SQZ | y | 120.77 | 124 | 91 | 128.23 | 6.18% | 8.33% |
| 2017-02-09 | AEL | CWH | n | 24.61 | 26 | 93 | 26.1 | 6.05% | 7.44% |
| 2017-02-09 | PCMI | CWH | n | 25.75 | 26 | 97 | 26.95 | 4.66% | 5.63% |
| 2017-02-08 | BZUN | SQZ | y | 14.38 | 14 | 96 | 15.01 | 4.38% | 7.09% |
| 2017-02-10 | PRCP | CWH | n | 7.75 | 8 | 83 | 8.07 | 4.13% | 4.9% |
| 2017-02-08 | GWPH | SQZ | y | 123.94 | 129 | 92 | 128.23 | 3.46% | 5.56% |
| 2017-02-10 | VVI | DB | n | 45.45 | 47 | 75 | 46.95 | 3.3% | 3.41% |
| 2017-02-07 | TSC | SQZ | y | 22.56 | 23 | 93 | 23.3 | 3.28% | 4.39% |
| 2017-02-08 | MOMO | CWH | n | 23.86 | 25 | 85 | 24.61 | 3.14% | 6.04% |
| 2017-02-10 | CRESY | CWH | n | 18.35 | 19 | 82 | 18.85 | 2.72% | 3.54% |
| 2017-02-06 | PLUS | SQZ | y | 119.21 | 121 | 81 | 122.4 | 2.68% | 3.93% |
| 2017-02-08 | FRPT | CWH | n | 11.46 | 12 | 86 | 11.75 | 2.53% | 4.71% |
| 2017-02-08 | WNR | SQZ | y | 36.60 | 37 | 90 | 37.47 | 2.38% | 3.39% |
| 2017-02-10 | LPLA | SQZ | y | 40.23 | 41 | 85 | 40.75 | 1.29% | 4.37% |
| 2017-02-10 | JACK | DB | y | 111.27 | 112 | 75 | 111.92 | 0.58% | 1.08% |
| 2017-02-09 | NSR | SQZ | y | 33.41 | 34 | 89 | 33.5 | 0.27% | 2.96% |
| 2017-02-07 | PGC | SQZ | y | 31.91 | 32 | 93 | 31.68 | -0.72% | 1.85% |
| 2017-02-06 | JCAP | SQZ | y | 21.61 | 22 | 90 | 21.25 | -1.67% | 2.73% |
| 2017-02-07 | ISIL | CWH | n | 22.47 | 22 | 89 | 22.08 | -1.74% | -0.36% |
| 2017-02-09 | MBTF | CWH | n | 11.75 | 12 | 84 | 11.3 | -3.83% | 2.13% |
| 2017-02-07 | STRL | CWH | n | 9.48 | 10 | 94 | 8.8 | -7.17% | 2.11% |
| *RS Rank on day before breakout. | |||||||||
| Symbol | BO Price |
BO Vol. |
Company | Industry | RS Rank |
Last Close |
|---|---|---|---|---|---|---|
| NRP | 39.36 | 70,792 | Natural Resource Partners LP | Industrial Metals & Minerals | 98 | 37.20 |
| STS | 19.90 | 267,183 | Supreme Industries - Inc. | Trucks & Other Vehicles | 96 | 18.86 |
| CARB | 20.48 | 605,124 | Carbonite - Inc. | Business Software & Services | 95 | 19.13 |
| BOOM | 16.80 | 60,344 | DMC Global Inc. | Metal Fabrication | 94 | 16.20 |
| SPXC | 25.50 | 356,574 | SPX Corporation | Diversified Machinery | 94 | 24.73 |
| MTZ | 41.90 | 1,230,362 | MasTec - Inc. | Heavy Construction | 94 | 38.85 |
| These stocks meet our suggested screening factors
for our Cup and Handle Chart Pattern watchlist. See Revised Rules for Trading Cup and Handle Breakouts |
||||||
| Index | Value | Change Week | Change YTD | Trend1 |
|---|---|---|---|---|
| Dow | 20269.4 |
0.99% | 2.56% | Up |
| NASDAQ | 5734.13 |
1.19% | 6.52% | Up |
| S&P 500 | 2316.1 |
0.81% | 3.45% | Up |
|
1The Market Trend is derived from
our proprietary market model. The market model is described on
the sitehere.
2The site also shows industry rankings based on fundamentals, combined technical and fundamentals, and on price alone. The site also shows daily industry movements. |
||||
| 1 Week | 13 Weeks | 26 Weeks | Year-to-Date |
|---|---|---|---|
| NASDAQ Composite |
NASDAQ Composite 9.49 % |
NASDAQ Composite 9.58 % |
NASDAQ Composite 6.52 % |
| 1 Week | 3 Weeks | 13 Weeks | 26 Weeks |
|---|---|---|---|
| Long Distance Carriers |
Basic Materials Wholesale |
Regional - Southwest Banks |
Manufactured Housing |
| Electronic Equipment 41 |
Publishing - Periodicals 99 |
Aerospace/Defense - Major Diversified 146 |
Long Distance Carriers 213 |
| Charts of each industry rank and performance over 12 months are available on the site | |||
If you received this newsletter from a friend and you would like to receive it regularly please go to the BreakoutWatch.com site and you will then be able to register to receive the newsletter.
Copyright (c) 02/11/2017 NBIcharts, LLC dba BreakoutWatch.com. All
rights reserved.
" BreakoutWatch," the BreakoutWatch.com "eye" logo, and the slogan
"tomorrow's breakouts today" are service marks of NBIcharts LLC. All
other marks are the property of their respective owners, and are used
for descriptive purposes only.
BreakoutWatch is not affiliated with Investor's Business Daily or with Mr. William O'Neil. Our site, research and analysis is supported entirely by subscription and is free from advertising.