Breakoutwatch Weekly Summary 03/04/17
You are receiving this email because you are or were a BreakoutWatch.com subscriber, or have subscribed to our weekly newsletter. This newsletter summarizes the breakout events of the week and provides additional guidance that does not fit into our daily format. It is published each weekend.
| The NASDAQ Composite lagged behind the
DJI and S&P 500 this week with a gain of 0.4% but comfortably
leads year-to-date with a 9.1% gain compared to 6.3% for the DJI
and 6.4% for the S&P 500. The chart shows the index still performing strongly although a near certain increase in the Fed Funds rate in March may curtail enthusiasm somewhat. Note that the market gapped up on Wednesday after the "presidential" speech but fell on Thursday as sounder analysis returned and Friday's low volume may have been in response to Chairman Yellen all but confirming there will be a rate increase this month. The week produced some very strong intra-day breakouts averaging 9.9% from breakout to end-of-day close. The average return of 5% by weeks end was also very good. 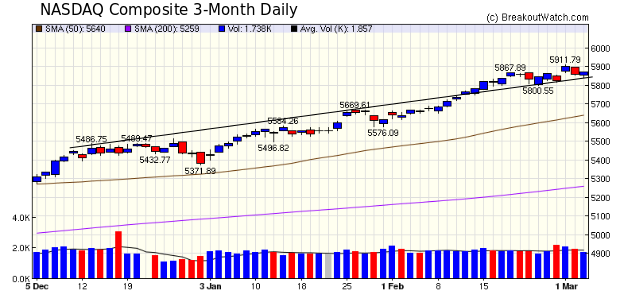 |
| I noticed that the performance reports for each watchlist were not accurate and these have been corrected. I also see that performance of Volatility Squeeze stocks is not included and I hope to correct that next week, time permitting. |
|
Our latest strategy suggestions are here. Have you Considered Call Options as a Trading Strategy? As CALA broke out from a High Tight Flag pattern on Wednesday a subscriber bought a call option. The next day he emailed me to say "Thanks Mike. Got out of those CALA Apr Calls at the high today when CALA was $13.70, made 168% in 1 day on the trade, paid for about 3 years worth of subscription with profit on first trade. Lol."You can read about call options here. |
| List | Breakouts | Avg. Gain |
|---|---|---|
| CWH | 9 | 1.65 |
| SQZ | 12 | 5.03 |
| HTF | 1 | 26.53 |
| HSB | 0 | |
| DB | 2 | 9.17 |
| Brkout Date | Symbol | Base | Squeeze | BrkoutOut Price | Brkout Day Close | RS Rank* | Last Close | Current % off BOP | Gain at Intraday High |
|---|---|---|---|---|---|---|---|---|---|
| 2017-03-01 | CALA | HTF | n | 9.80 | 12 | 98 | 12.4 | 26.53% | 39.8% |
| 2017-02-27 | IBP | DB | y | 43.30 | 46 | 84 | 49.65 | 14.67% | 15.59% |
| 2017-03-01 | SBLK | SQZ | y | 9.38 | 10 | 98 | 10.71 | 14.18% | 18.76% |
| 2017-03-02 | SRPT | SQZ | y | 30.39 | 33 | 84 | 34.39 | 13.16% | 14.68% |
| 2017-02-28 | EPZM | CWH | n | 13.65 | 14 | 86 | 15 | 9.89% | 12.82% |
| 2017-03-02 | NNBR | SQZ | y | 20.71 | 22 | 80 | 22.65 | 9.37% | 12.02% |
| 2017-02-28 | IPDN | SQZ | y | 11.51 | 13 | 98 | 12.53 | 8.86% | 20.76% |
| 2017-03-01 | ERI | CWH | n | 16.80 | 17 | 80 | 18.2 | 8.33% | 8.93% |
| 2017-02-27 | MB | SQZ | y | 25.96 | 27 | 95 | 27.3 | 5.16% | 5.55% |
| 2017-03-01 | XNCR | SQZ | y | 24.86 | 27 | 89 | 26.13 | 5.11% | 15.21% |
| 2017-03-01 | ALKS | DB | y | 58.81 | 60 | 74 | 60.97 | 3.67% | 6.27% |
| 2017-02-28 | GLNG | SQZ | y | 26.91 | 27 | 84 | 27.79 | 3.27% | 5.39% |
| 2017-03-02 | MEI | SQZ | y | 43.36 | 44 | 82 | 44.5 | 2.63% | 5.97% |
| 2017-02-27 | QUAD | SQZ | y | 26.93 | 27 | 92 | 27.6 | 2.49% | 5.46% |
| 2017-03-02 | FOXF | CWH | n | 28.45 | 29 | 83 | 28.9 | 1.58% | 5.98% |
| 2017-03-01 | LBAI | CWH | n | 20.30 | 20 | 92 | 20.4 | 0.49% | 1.48% |
| 2017-02-27 | STS | CWH | n | 19.90 | 20 | 93 | 19.84 | -0.3% | 5.53% |
| 2017-02-27 | AIMC | CWH | n | 40.65 | 41 | 86 | 40.5 | -0.37% | 15.38% |
| 2017-03-02 | CRBP | CWH | n | 9.35 | 9 | 99 | 9.3 | -0.53% | 8.56% |
| 2017-02-28 | UMH | SQZ | y | 14.80 | 15 | 85 | 14.65 | -1.01% | 1.42% |
| 2017-02-27 | IDT | SQZ | y | 19.63 | 20 | 85 | 19.38 | -1.27% | 4.08% |
| 2017-03-02 | PODD | CWH | n | 46.92 | 47 | 87 | 46.3 | -1.32% | 2.79% |
| 2017-02-27 | SPXC | SQZ | y | 26.93 | 28 | 96 | 26.51 | -1.56% | 4.46% |
| 2017-03-01 | UMBF | CWH | n | 80.96 | 81 | 81 | 78.57 | -2.95% | 0.73% |
| *RS Rank on day before breakout. | |||||||||
| |
| Symbol | BO Price |
BO Vol. |
Company | Industry | RS Rank |
Last Close |
|---|---|---|---|---|---|---|
| HSC | 14.80 | 690,130 | Harsco Corporation | Industrial Metals & Minerals | 96 | 13.70 |
| BZUN | 16.20 | 699,956 | Baozun Inc. | Catalog & Mail Order Houses | 95 | 14.04 |
| ETE | 19.85 | 7,858,167 | Energy Transfer Equity - L.P. | Oil & Gas Pipelines | 94 | 19.29 |
| BOOM | 17.00 | 50,170 | DMC Global Inc. | Metal Fabrication | 93 | 15.30 |
| IBTX | 66.85 | 105,724 | Independent Bank Group - Inc | Regional - Southeast Banks | 92 | 62.85 |
| These stocks meet our suggested screening factors
for our Cup and Handle Chart Pattern watchlist. See Revised Rules for Trading Cup and Handle Breakouts |
||||||
| Index | Value | Change Week | Change YTD | Trend1 |
|---|---|---|---|---|
| Dow | 21005.7 |
0.88% | 6.29% | Up |
| NASDAQ | 5870.75 |
0.44% | 9.06% | Up |
| S&P 500 | 2383.12 |
0.67% | 6.44% | Up |
|
1The Market Trend is derived from
our proprietary market model. The market model is described on
the sitehere.
2The site also shows industry rankings based on fundamentals, combined technical and fundamentals, and on price alone. The site also shows daily industry movements. |
||||
| 1 Week | 13 Weeks | 26 Weeks | Year-to-Date |
|---|---|---|---|
| Dow Jones |
NASDAQ Composite 9.57 % |
Dow Jones 13.59 % |
NASDAQ Composite 9.06 % |
| 1 Week | 3 Weeks | 13 Weeks | 26 Weeks |
|---|---|---|---|
| Regional - Southwest Banks |
Consumer Services |
Consumer Services |
Regional - Southwest Banks |
| Beverages - Wineries & Distillers 52 |
Manufactured Housing 100 |
Aluminum 160 |
Long Distance Carriers 192 |
| Charts of each industry rank and performance over 12 months are available on the site | |||
If you received this newsletter from a friend and you would like to receive it regularly please go to the BreakoutWatch.com site and you will then be able to register to receive the newsletter.
Copyright (c) 03/04/2017 NBIcharts, LLC dba BreakoutWatch.com. All
rights reserved.
" BreakoutWatch," the BreakoutWatch.com "eye" logo, and the slogan
"tomorrow's breakouts today" are service marks of NBIcharts LLC. All
other marks are the property of their respective owners, and are used
for descriptive purposes only.
BreakoutWatch is not affiliated with Investor's Business Daily or with Mr. William O'Neil. Our site, research and analysis is supported entirely by subscription and is free from advertising.