Breakoutwatch Weekly Summary 04/29/17
You are receiving this email because you are or were a BreakoutWatch.com subscriber, or have subscribed to our weekly newsletter. This newsletter summarizes the breakout events of the week and provides additional guidance that does not fit into our daily format. It is published each weekend.
| Trend Indicators Return to Positive
Reading The NASDAQ gapped up at Monday's open in response to a positive outcome from the first round of French Presidential elections. The strong showing moved the needle on our trend indicators and they returned to positive for all three major indexes. The NASDAQ recorded an accumulation day and followed through on Tuesday with another. Wednesday saw a mild retreat in response to Trump's one page tax plan which threatens to add significantly to the deficit. The week ended with a distribution day on Friday as first quarter GDP growth was reported as a disappointing 0.7%. The NASDAQ was the strongest of the the major indexes with a gain of 2.3%. Volumes were generally strong producing 43 breakouts, most of them (31) coming from Volatility Squeeze situations. CACQ was a double breakout as it broke out from a cup and handle pattern on Wednesday and Volatility Squeeze on Thursday. This was possible as the first breakout did not lift the price sufficiently to relieve the squeeze whereas Thursdays move did. The stock went on to be the highest gainer of the week with a 9% gain by Friday's close. 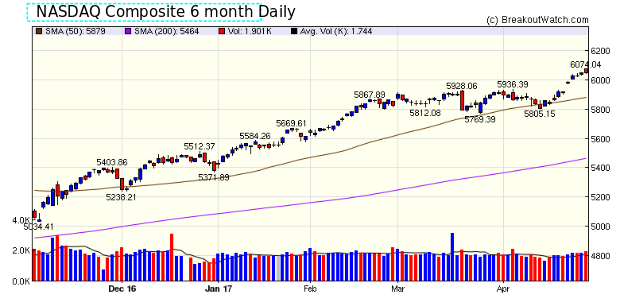 |
| No new features this week. |
| List | Breakouts | Avg. Gain |
|---|---|---|
| CWH | 6 | 1.14 |
| SQZ | 31 | 1.61 |
| HTF | 0 | |
| HSB | 0 | |
| DB | 6 | 2.29 |
| Brkout Date | Symbol | Base | Squeeze | BrkoutOut Price | Brkout Day Close | RS Rank* | Last Close | Current % off BOP | Gain at Intraday High |
|---|---|---|---|---|---|---|---|---|---|
| 2017-04-26 | CACQ | CWH | y | 16.00 | 16 | 89 | 17.45 | 9.06% | 9.38% |
| 2017-04-27 | CACQ | SQZ | y | 16.01 | 17 | 91 | 17.45 | 8.99% | 9.31% |
| 2017-04-25 | CENX | SQZ | y | 12.65 | 14 | 89 | 13.64 | 7.83% | 18.34% |
| 2017-04-25 | MSA | SQZ | y | 72.36 | 73 | 82 | 77.85 | 7.59% | 13.49% |
| 2017-04-26 | CZR | CWH | n | 10.35 | 11 | 84 | 11.1 | 7.25% | 8.21% |
| 2017-04-24 | RE | DB | n | 236.50 | 239 | 77 | 251.71 | 6.43% | 9.22% |
| 2017-04-25 | REX | SQZ | y | 89.20 | 94 | 81 | 94.68 | 6.14% | 8.62% |
| 2017-04-24 | INTT | SQZ | y | 6.56 | 7 | 96 | 6.95 | 5.95% | 10.52% |
| 2017-04-27 | LE | SQZ | y | 22.31 | 23 | 89 | 23.6 | 5.78% | 6.45% |
| 2017-04-25 | HDSN | SQZ | y | 6.80 | 7 | 82 | 7.1 | 4.41% | 12.35% |
| 2017-04-28 | ABCO | SQZ | y | 48.99 | 51 | 82 | 51.1 | 4.31% | 5.49% |
| 2017-04-24 | QCRH | SQZ | y | 43.96 | 46 | 91 | 45.6 | 3.73% | 7.6% |
| 2017-04-25 | SP | SQZ | y | 33.31 | 34 | 88 | 34.45 | 3.42% | 7.02% |
| 2017-04-25 | BHLB | DB | n | 36.30 | 37 | 74 | 37.5 | 3.31% | 6.47% |
| 2017-04-25 | MERC | SQZ | y | 11.81 | 12 | 84 | 12.2 | 3.3% | 7.54% |
| 2017-04-25 | PGC | SQZ | y | 31.05 | 32 | 89 | 32.06 | 3.25% | 8.47% |
| 2017-04-25 | LKFN | SQZ | y | 44.54 | 48 | 80 | 45.66 | 2.51% | 9.34% |
| 2017-04-25 | TMUS | SQZ | y | 65.94 | 67 | 88 | 67.27 | 2.02% | 3.41% |
| 2017-04-25 | FNGN | SQZ | y | 41.76 | 42 | 87 | 42.5 | 1.77% | 5.8% |
| 2017-04-25 | CSII | SQZ | y | 29.42 | 30 | 92 | 29.87 | 1.53% | 2.69% |
| 2017-04-24 | EIG | DB | n | 39.40 | 39 | 78 | 40 | 1.52% | 3.43% |
| 2017-04-24 | AXE | DB | n | 80.50 | 81 | 81 | 81.55 | 1.3% | 7.27% |
| 2017-04-25 | PSTB | SQZ | y | 12.16 | 12 | 92 | 12.3 | 1.15% | 4.61% |
| 2017-04-24 | FRBK | SQZ | y | 8.51 | 9 | 96 | 8.6 | 1.06% | 6.93% |
| 2017-04-25 | AXE | SQZ | y | 80.74 | 85 | 80 | 81.55 | 1% | 6.95% |
| 2017-04-25 | GD | SQZ | y | 191.92 | 193 | 83 | 193.79 | 0.97% | 2.63% |
| 2017-04-24 | STI | DB | n | 56.34 | 57 | 76 | 56.81 | 0.83% | 3.3% |
| 2017-04-25 | DCI | SQZ | y | 46.12 | 47 | 82 | 46.28 | 0.35% | 2.86% |
| 2017-04-24 | CBU | DB | n | 55.77 | 56 | 71 | 55.95 | 0.32% | 4.52% |
| 2017-04-26 | GD | SQZ | y | 193.25 | 195 | 83 | 193.79 | 0.28% | 1.92% |
| 2017-04-28 | SALE | CWH | n | 11.60 | 12 | 87 | 11.6 | 0% | 0.69% |
| 2017-04-24 | TNC | SQZ | y | 73.66 | 74 | 82 | 73.25 | -0.56% | 1.82% |
| 2017-04-25 | TITN | CWH | n | 15.95 | 16 | 86 | 15.85 | -0.63% | 5.33% |
| 2017-04-25 | INTT | SQZ | y | 7.01 | 7 | 97 | 6.95 | -0.86% | 3.42% |
| 2017-04-24 | MPO | SQZ | y | 18.76 | 19 | 99 | 18.56 | -1.07% | 3.89% |
| 2017-04-25 | PRI | SQZ | y | 84.76 | 85 | 93 | 83.8 | -1.13% | 0.83% |
| 2017-04-26 | RXDX | SQZ | y | 8.96 | 9 | 96 | 8.85 | -1.23% | 8.82% |
| 2017-04-26 | EVA | CWH | n | 29.60 | 30 | 83 | 29.15 | -1.52% | 3.38% |
| 2017-04-25 | QSR | SQZ | y | 57.63 | 58 | 85 | 56.17 | -2.53% | 1.72% |
| 2017-04-25 | MCBC | SQZ | y | 10.10 | 10 | 81 | 9.57 | -5.25% | 3.96% |
| 2017-04-25 | EVR | SQZ | y | 78.41 | 79 | 89 | 73.75 | -5.94% | 1.14% |
| 2017-04-24 | MTSI | CWH | n | 52.75 | 54 | 84 | 48.88 | -7.34% | 4.61% |
| 2017-04-26 | CHFN | SQZ | y | 20.16 | 21 | 92 | 18.35 | -8.98% | 4.71% |
| *RS Rank on day before breakout. | |||||||||
| |
| Symbol | BO Price |
BO Vol. |
Company | Industry | RS Rank |
Last Close |
|---|---|---|---|---|---|---|
| FRBK | 9.10 | 319,707 | Republic First Bancorp - Inc. | Regional - Northeast Banks | 96 | 8.60 |
| BZUN | 17.58 | 972,976 | Baozun Inc. | Catalog & Mail Order Houses | 96 | 15.24 |
| LMIA | 13.92 | 196,840 | LMI Aerospace - Inc. | Aerospace/Defense Products & Services | 96 | 13.87 |
| EDN | 37.12 | 73,396 | Empresa Distribuidora Y Comercializadora Norte S.A | Electric Utilities | 95 | 34.57 |
| ERS | 7.13 | 47,289 | Empire Resources - Inc. | Basic Materials Wholesale | 94 | 6.98 |
| RMR | 54.30 | 69,171 | The RMR Group Inc. | Closed-End Fund - Debt | 94 | 52.75 |
| SLM | 13.20 | 4,961,367 | SLM Corporation | Credit Services | 94 | 12.54 |
| RAVN | 31.60 | 292,350 | Raven Industries - Inc. | Diversified Machinery | 93 | 31.00 |
| PRI | 85.55 | 474,756 | Primerica - Inc. | Life Insurance | 92 | 83.80 |
| FOXF | 30.50 | 507,483 | Fox Factory Holding Corp. | Recreational Vehicles | 92 | 30.05 |
| These stocks meet our suggested screening factors
for our Cup and Handle Chart Pattern watchlist. See Revised Rules for Trading Cup and Handle Breakouts |
||||||
| Index | Value | Change Week | Change YTD | Trend1 |
|---|---|---|---|---|
| Dow | 20940.5 |
1.91% | 5.96% | Up |
| NASDAQ | 6047.61 |
2.32% | 12.34% | Up |
| S&P 500 | 2384.2 |
1.51% | 6.49% | Up |
|
1The Market Trend is derived from
our proprietary market model. The market model is described on
the sitehere.
2The site also shows industry rankings based on fundamentals, combined technical and fundamentals, and on price alone. The site also shows daily industry movements. |
||||
| 1 Week | 13 Weeks | 26 Weeks | Year-to-Date |
|---|---|---|---|
| NASDAQ Composite |
NASDAQ Composite 6.83 % |
NASDAQ Composite 16.52 % |
NASDAQ Composite 12.34 % |
| 1 Week | 3 Weeks | 13 Weeks | 26 Weeks |
|---|---|---|---|
| Building Materials Wholesale |
Long Distance Carriers |
Consumer Services |
Regional - Southwest Banks |
| Hospitals 46 |
Computers Wholesale 190 |
Computers Wholesale 199 |
Long Distance Carriers 195 |
| Charts of each industry rank and performance over 12 months are available on the site | |||
If you received this newsletter from a friend and you would like to receive it regularly please go to the BreakoutWatch.com site and you will then be able to register to receive the newsletter.
Copyright (c) 04/29/2017 NBIcharts, LLC dba BreakoutWatch.com. All
rights reserved.
" BreakoutWatch," the BreakoutWatch.com "eye" logo, and the slogan
"tomorrow's breakouts today" are service marks of NBIcharts LLC. All
other marks are the property of their respective owners, and are used
for descriptive purposes only.
BreakoutWatch is not affiliated with Investor's Business Daily or with Mr. William O'Neil. Our site, research and analysis is supported entirely by subscription and is free from advertising.