Breakoutwatch Weekly Summary 06/10/17
You are receiving this email because you are or were a BreakoutWatch.com subscriber, or have subscribed to our weekly newsletter. This newsletter summarizes the breakout events of the week and provides additional guidance that does not fit into our daily format. It is published each weekend.
| The NASDAQ Composite fell 1.8% on
Friday on volume that was 1.6 times the 50 day average. The fall
seems to have been provoked by traders reaction to reports by
Goldman Sachs and UBS that the FANG stocks are in a bubble. You
can read the analysis by Barron's in Did
Goldman Just Kill the Tech Rally? Overall the NASDAQ
lost 1.6% for the week while the DJI gained 0.3% and the S&P
500 (which includes the FANG stocks) gave up 0.3%. The number of breakouts increased to 20 this week with 7 cup and handle breakouts contributing the largest gains while Volatility Squeeze breakouts were in the majority. 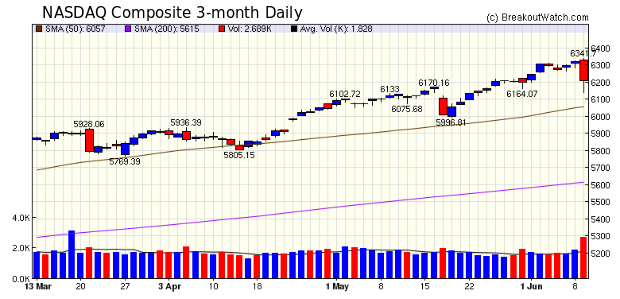 |
| A new watchlist was added this week: New Highs. These are stocks that have strong momentum and are likely to move even higher. I will be adding alerts based on this list and trading hints in the near future. This watchlist is updated daily and shows stocks making a new all-time high on that day. The watchlist is accessed from the Mine for Candidates >Long Positions> New Highs menu choice. 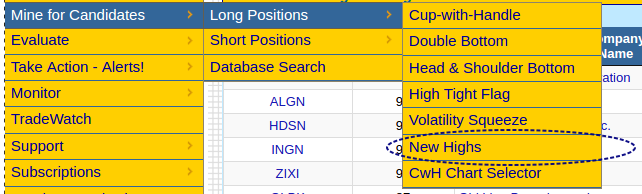 |
|
Our latest strategy
suggestions are here.
|
| List | Breakouts | Avg. Gain |
|---|---|---|
| CWH | 7 | 5.79 |
| SQZ | 11 | 2.72 |
| HTF | 0 | |
| HSB | 0 | |
| DB | 2 | 2.48 |
| Brkout Date | Symbol | Base | Squeeze | BrkoutOut Price | Brkout Day Close | RS Rank* | Last Close | Current % off BOP | Gain at Intraday High |
|---|---|---|---|---|---|---|---|---|---|
| 2017-06-06 | PTCT | CWH | n | 13.85 | 14 | 93 | 16.39 | 18.34% | 22.74% |
| 2017-06-07 | KITE | SQZ | y | 76.65 | 82 | 84 | 87.79 | 14.53% | 19.71% |
| 2017-06-06 | TEX | SQZ | y | 33.46 | 34 | 82 | 36.09 | 7.86% | 11.06% |
| 2017-06-05 | XPO | CWH | n | 55.66 | 58 | 90 | 59.21 | 6.38% | 8.73% |
| 2017-06-06 | ZGNX | CWH | n | 13.82 | 15 | 89 | 14.6 | 5.64% | 9.99% |
| 2017-06-08 | LBAI | SQZ | y | 19.06 | 19 | 81 | 20.05 | 5.19% | 7.29% |
| 2017-06-08 | BDE | CWH | n | 6.45 | 6 | 82 | 6.75 | 4.65% | 5.43% |
| 2017-06-05 | ALRM | CWH | n | 33.94 | 35 | 84 | 35.31 | 4.04% | 5.75% |
| 2017-06-08 | JCAP | SQZ | y | 22.38 | 24 | 83 | 23.25 | 3.89% | 5.67% |
| 2017-06-09 | LBAI | SQZ | y | 19.41 | 20 | 83 | 20.05 | 3.3% | 5.36% |
| 2017-06-09 | BNCN | DB | n | 35.00 | 36 | 76 | 36.15 | 3.29% | 3.57% |
| 2017-06-09 | FRME | SQZ | y | 41.32 | 43 | 86 | 42.6 | 3.1% | 3.34% |
| 2017-06-09 | QCRH | SQZ | y | 46.51 | 48 | 88 | 47.8 | 2.77% | 3.42% |
| 2017-06-09 | BEAT | DB | y | 30.00 | 31 | 93 | 30.5 | 1.67% | 1.83% |
| 2017-06-09 | OSBC | SQZ | y | 12.01 | 12 | 88 | 12.15 | 1.17% | 1.58% |
| 2017-06-09 | PGC | SQZ | y | 30.61 | 31 | 83 | 30.95 | 1.11% | 1.89% |
| 2017-06-06 | ALR | CWH | n | 49.53 | 50 | 84 | 49.95 | 0.85% | 0.91% |
| 2017-06-06 | NTES | CWH | n | 301.82 | 303 | 86 | 303.62 | 0.6% | 7.05% |
| 2017-06-08 | RTEC | SQZ | y | 26.31 | 27 | 92 | 25.55 | -2.89% | 3.76% |
| 2017-06-06 | RPD | SQZ | y | 19.01 | 19 | 93 | 17.08 | -10.15% | 1.1% |
| *RS Rank on day before breakout. | |||||||||
| Symbol | BO Price |
BO Vol. |
Company | Industry | RS Rank |
Last Close |
|---|---|---|---|---|---|---|
| MPX | 14.40 | 47,470 | Marine Products Corporation | Recreational Vehicles | 93 | 13.99 |
| XCRA | 10.00 | 1,496,314 | Xcerra Corporation | Semiconductor Equipment & Materials | 92 | 9.96 |
| These stocks meet our suggested screening factors
for our Cup and Handle Chart Pattern watchlist. See Revised Rules for Trading Cup and Handle Breakouts |
||||||
| Index | Value | Change Week | Change YTD | Trend1 |
|---|---|---|---|---|
| Dow | 21272 |
0.31% | 7.64% | Up |
| NASDAQ | 6207.92 |
-1.55% | 15.32% | Up |
| S&P 500 | 2431.77 |
-0.3% | 8.62% | Up |
|
1The Market Trend is derived from
our proprietary market model. The market model is described on
the sitehere.
2The site also shows industry rankings based on fundamentals, combined technical and fundamentals, and on price alone. The site also shows daily industry movements. |
||||
| 1 Week | 13 Weeks | 26 Weeks | Year-to-Date |
|---|---|---|---|
| Dow Jones |
NASDAQ Composite 5.91 % |
NASDAQ Composite 14.02 % |
NASDAQ Composite 15.32 % |
| 1 Week | 3 Weeks | 13 Weeks | 26 Weeks |
|---|---|---|---|
| Appliances |
Consumer Services |
Consumer Services |
Consumer Services |
| Synthetics 60 |
Synthetics 153 |
Synthetics 204 |
Synthetics 204 |
| Charts of each industry rank and performance over 12 months are available on the site | |||
If you received this newsletter from a friend and you would like to receive it regularly please go to the BreakoutWatch.com site and you will then be able to register to receive the newsletter.
Copyright (c) 06/10/2017 NBIcharts, LLC dba BreakoutWatch.com. All
rights reserved.
" BreakoutWatch," the BreakoutWatch.com "eye" logo, and the slogan
"tomorrow's breakouts today" are service marks of NBIcharts LLC. All
other marks are the property of their respective owners, and are used
for descriptive purposes only.
BreakoutWatch is not affiliated with Investor's Business Daily or with Mr. William O'Neil. Our site, research and analysis is supported entirely by subscription and is free from advertising.