Breakoutwatch Weekly Summary 06/17/17
You are receiving this email because you are or were a BreakoutWatch.com subscriber, or have subscribed to our weekly newsletter. This newsletter summarizes the breakout events of the week and provides additional guidance that does not fit into our daily format. It is published each weekend.
| Each week we consider the NASDAQ chart
because we have found that most breakouts come from stocks listed
in that index. This week the NASDAQ took a modest retreat with a
loss of 0.22%. This was a hangover from last Friday's 1.8% loss
provoked by speculation that FANG (Facebook, Amazon, Netflix,
Google) stocks were in a bubble. Monday and Tuesday saw these
stocks recover somewhat but the index moved down on Wednesday and
Thursday while Friday's 'doji' candlestick showed there was still
uncertainty about the future direction, although there was no
uncertainty about what the markets thought about Amazon's
acquisition of Whole Foods as AMZN gained 2.5% on 3.4 times
average volume. Another consistent feature of our analysis is that cup and handle pattern breakouts generally provide greater gains than breakouts from any other pattern. This is true again this week, although the average gain was bolstered by an exceptionally strong breakout from OMER. This was foreshadowed by action in the handle on the day before breakout as I show below. 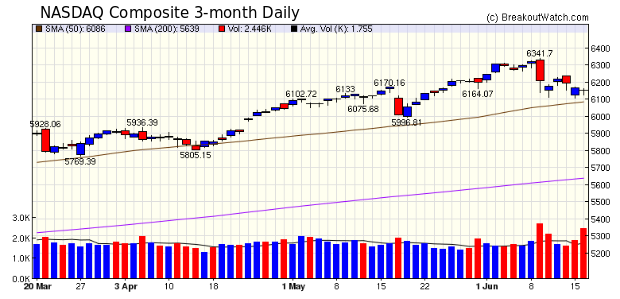 |
| No new features this week. Some bugs in the new watchlist of stocks reaching New 12 Month Highs were corrected, particularly the estimated EPS column and its sorting. |
|
Study Handle Action
for Cup and Handle Pattern Likely Breakouts
The likelihood of a coming breakout can often be seen when a price and volume rise in the later stages the handle (see our tutorial Anatomy of a Cup-with-Handle Chart Pattern). The breakout of OMER was foreshadowed on Monday 6/12/17 when, after a long handle in which the price drifted down, the stock suddenly gained 11.9% on 2.5 times average volume. We issued an alert the next day at 09:45 as the price reached 17.26 (breakout price was 17.19). OMER closed on Friday 37.6% above that alert price. 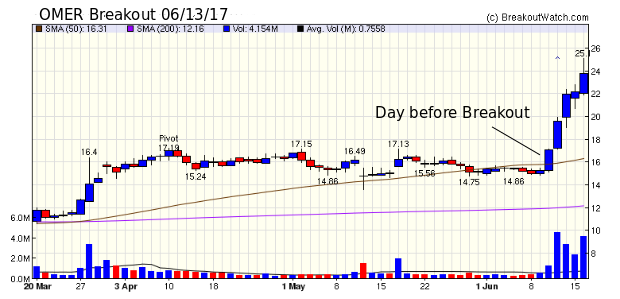 |
| List | Breakouts | Avg. Gain |
|---|---|---|
| CWH | 5 | 9.24 |
| SQZ | 9 | 0.6 |
| HTF | 0 | |
| HSB | 1 | 6.01 |
| DB | 1 | 0.85 |
| Brkout Date | Symbol | Base | Squeeze | BrkoutOut Price | Brkout Day Close | RS Rank* | Last Close | Current % off BOP | Gain at Intraday High |
|---|---|---|---|---|---|---|---|---|---|
| 2017-06-13 | OMER | CWH | y | 17.19 | 20 | 95 | 23.75 | 38.16% | 46.02% |
| 2017-06-16 | FOLD | CWH | n | 8.84 | 9 | 92 | 9.43 | 6.67% | 7.24% |
| 2017-06-15 | EPZM | HSB | n | 12.90 | 14 | 42 | 13.675 | 6.01% | 12.4% |
| 2017-06-16 | IR | SQZ | y | 89.87 | 92 | 84 | 92.34 | 2.75% | 2.75% |
| 2017-06-16 | GBNK | SQZ | y | 25.56 | 26 | 86 | 26.25 | 2.7% | 2.7% |
| 2017-06-12 | HFWA | SQZ | y | 25.51 | 26 | 81 | 26.1 | 2.31% | 2.51% |
| 2017-06-15 | SPNC | SQZ | y | 29.16 | 30 | 80 | 29.8 | 2.19% | 4.6% |
| 2017-06-16 | TBPH | SQZ | y | 36.38 | 37 | 84 | 36.99 | 1.68% | 2.97% |
| 2017-06-16 | CHDN | CWH | n | 179.75 | 182 | 83 | 182.45 | 1.5% | 1.64% |
| 2017-06-16 | PH | DB | n | 161.24 | 163 | 76 | 162.61 | 0.85% | 0.86% |
| 2017-06-16 | JCAP | CWH | n | 23.69 | 24 | 86 | 23.87 | 0.76% | 0.84% |
| 2017-06-12 | MBLY | SQZ | y | 62.31 | 63 | 94 | 62.7 | 0.63% | 1.04% |
| 2017-06-13 | ESXB | CWH | n | 8.25 | 8 | 86 | 8.175 | -0.91% | 0.61% |
| 2017-06-12 | LBAI | SQZ | y | 20.06 | 20 | 86 | 19.8 | -1.3% | 2.69% |
| 2017-06-12 | TSC | SQZ | y | 24.81 | 25 | 91 | 24.45 | -1.45% | 2.78% |
| 2017-06-13 | TICC | SQZ | y | 7.33 | 7 | 80 | 7.03 | -4.09% | 1.23% |
| *RS Rank on day before breakout. | |||||||||
| |
| Symbol | BO Price |
BO Vol. |
Company | Industry | RS Rank |
Last Close |
|---|---|---|---|---|---|---|
| CAI | 22.00 | 201,546 | CAI International - Inc. | Rental & Leasing Services | 98 | 20.95 |
| FSTR | 20.15 | 69,903 | L.B. Foster Company | Railroads | 95 | 19.60 |
| PNRA | 314.67 | 831,916 | Panera Bread Company | Specialty Eateries | 94 | 314.57 |
| NORD | 32.70 | 863,300 | Nord Anglia Education - Inc. | Education & Training Services | 93 | 32.41 |
| MOH | 70.08 | 2,286,078 | Molina Healthcare Inc | Health Care Plans | 92 | 68.79 |
| XCRA | 10.00 | 1,482,681 | Xcerra Corporation | Semiconductor Equipment & Materials | 92 | 9.88 |
| These stocks meet our suggested screening factors
for our Cup and Handle Chart Pattern watchlist. See Revised Rules for Trading Cup and Handle Breakouts |
||||||
| Index | Value | Change Week | Change YTD | Trend1 |
|---|---|---|---|---|
| Dow | 21384.3 |
0.53% | 8.21% | Up |
| NASDAQ | 6151.76 |
-0.9% | 14.28% | Up |
| S&P 500 | 2433.15 |
0.06% | 8.68% | Up |
|
1The Market Trend is derived from
our proprietary market model. The market model is described on
the sitehere.
2The site also shows industry rankings based on fundamentals, combined technical and fundamentals, and on price alone. The site also shows daily industry movements. |
||||
| 1 Week | 13 Weeks | 26 Weeks | Year-to-Date |
|---|---|---|---|
| Dow Jones |
NASDAQ Composite 4.25 % |
NASDAQ Composite 13.14 % |
NASDAQ Composite 14.28 % |
| 1 Week | 3 Weeks | 13 Weeks | 26 Weeks |
|---|---|---|---|
| Appliances |
Appliances |
Consumer Services |
Consumer Services |
| Small Tools & Accessories 70 |
Synthetics 61 |
Computers Wholesale 185 |
Computers Wholesale 180 |
| Charts of each industry rank and performance over 12 months are available on the site | |||
If you received this newsletter from a friend and you would like to receive it regularly please go to the BreakoutWatch.com site and you will then be able to register to receive the newsletter.
Copyright (c) 06/17/2017 NBIcharts, LLC dba BreakoutWatch.com. All
rights reserved.
" BreakoutWatch," the BreakoutWatch.com "eye" logo, and the slogan
"tomorrow's breakouts today" are service marks of NBIcharts LLC. All
other marks are the property of their respective owners, and are used
for descriptive purposes only.
BreakoutWatch is not affiliated with Investor's Business Daily or with Mr. William O'Neil. Our site, research and analysis is supported entirely by subscription and is free from advertising.