Breakoutwatch Weekly Summary 10/07/17
You are receiving this email because you are or were a BreakoutWatch.com subscriber, or have subscribed to our weekly newsletter. This newsletter summarizes the breakout events of the week and provides additional guidance that does not fit into our daily format. It is published each weekend.
|
New Watchlist Filter + Can the Upward Trend Continue?
Yardeni Says Yes The NASDAQ Composite closed on Friday with its 9th consecutive record high and our market trend signals continue to point upwards. Can this trend continue? Looking at the chart below, there is a sign that trader confidence in the upward trend, while still positive, is waning. Note that while price has continued to rise, daily volume since last Tuesday has declined. This is a sign that traders are becoming more cautious. This week, I chose to add the 1 standard deviation and 2 standard deviation Bollinger Bands to the chart. These show that the index is at the 2 standard deviation limit, or close to it, for the last week. While this doesn't mean a price decline is imminent, it is a sign that one may be coming soon. Why do I say this? Because Bollinger Bands are a measure of price volatility. As volatility increases the bands widen and as volatility decreases the bands narrow. As volatility approaches extremes, then it has an increasing likelihood of reverting to the mean volatility. Therefore, I think it likely that we will see some price consolidation in the very near future. Does price consolidation mean the upward trend is dead? No. In Barry Ritholz blog yesterday he says "Ed Yardeni, who has been about as right about this market since the 2009 lows as anyone, believes stocks still have some room to run.....For a variety of other reasons, I agree with him."During consolidation, there will be fewer breakouts. See Strategy Suggestions below to increase the probability of picking cup and pattern handle winners as the pool dries up. 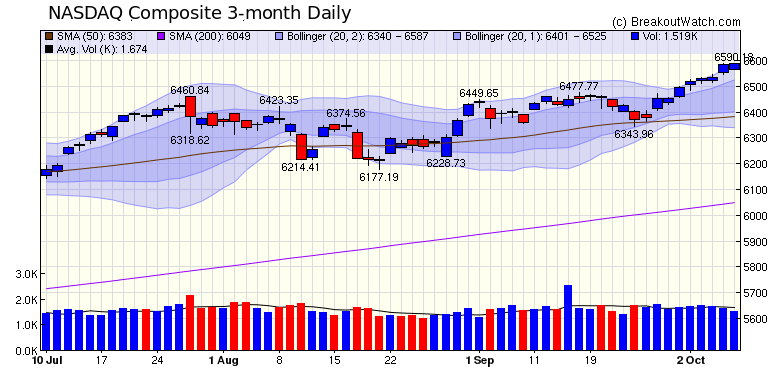 |
| New Cup and Handle Watchlist Filter - see below We did move to our new server on Monday. Although alerts were delayed initially, everything was working smoothly by Tuesday. |
|
I've often drawn attention to the importance of selecting high RS Rank value stocks with increasing price and volume in the handle. This week's top performer, FMI, is another example of how those criteria can lead to solid breakouts. 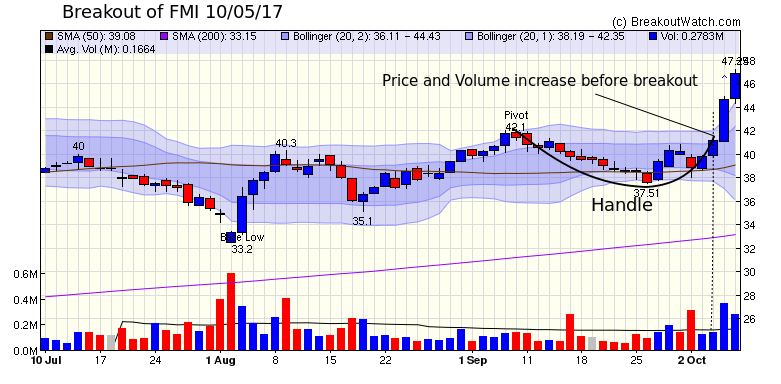 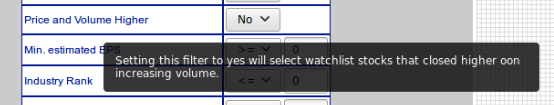 Our latest strategy suggestions are here. |
| List | Breakouts | Avg. Gain |
|---|---|---|
| CWH | 14 | 2.18 |
| SQZ | 7 | 3.19 |
| HTF | ||
| HSB | ||
| DB | 2 | 2.98 |
| Brkout Date | Symbol | Base | Squeeze | BrkoutOut Price | Brkout Day Close | RS Rank* | Last Close | Current % off BOP | Gain at Intraday High |
|---|---|---|---|---|---|---|---|---|---|
| 2017-10-05 | FMI | CWH | n | 42.10 | 45 | 96 | 46.9 | 11.4% | 12.23% |
| 2017-10-03 | ITI | CWH | n | 6.81 | 7 | 93 | 7.43 | 9.1% | 14.1% |
| 2017-10-02 | CYTK | SQZ | y | 14.51 | 15 | 87 | 15.5 | 6.82% | 9.92% |
| 2017-10-05 | MTLS | CWH | n | 15.00 | 16 | 96 | 15.9 | 6% | 10% |
| 2017-10-05 | NFLX | CWH | n | 189.95 | 194 | 93 | 198.02 | 4.25% | 4.72% |
| 2017-10-03 | CYTK | SQZ | y | 14.91 | 15 | 89 | 15.5 | 3.96% | 6.98% |
| 2017-10-02 | BERY | DB | y | 57.04 | 57 | 72 | 59.26 | 3.89% | 4.05% |
| 2017-10-06 | BGC | CWH | n | 20.30 | 21 | 82 | 21 | 3.45% | 6.65% |
| 2017-10-02 | NKTR | SQZ | y | 24.01 | 25 | 92 | 24.81 | 3.33% | 4.21% |
| 2017-10-03 | LPSN | SQZ | y | 14.26 | 14 | 96 | 14.7 | 3.09% | 4.14% |
| 2017-10-06 | FIVE | CWH | n | 55.58 | 57 | 87 | 57.28 | 3.06% | 3.72% |
| 2017-10-04 | DCO | CWH | n | 33.00 | 34 | 82 | 33.99 | 3% | 4.15% |
| 2017-10-05 | PPBI | DB | n | 38.70 | 39 | 72 | 39.5 | 2.07% | 4.26% |
| 2017-10-03 | PZE | SQZ | y | 12.86 | 13 | 93 | 13.1 | 1.87% | 2.95% |
| 2017-10-03 | SLP | SQZ | y | 16.16 | 17 | 95 | 16.45 | 1.79% | 7.67% |
| 2017-10-04 | HCOM | SQZ | y | 30.22 | 31 | 87 | 30.67 | 1.49% | 2.51% |
| 2017-10-05 | CMA | CWH | n | 76.76 | 77 | 82 | 76.92 | 0.21% | 1.55% |
| 2017-10-06 | CALA | CWH | n | 17.25 | 17 | 99 | 17.25 | 0% | 0.87% |
| 2017-10-05 | NWPX | CWH | n | 19.69 | 20 | 86 | 19.64 | -0.25% | 1.98% |
| 2017-10-03 | INDB | CWH | n | 75.65 | 76 | 80 | 74.85 | -1.06% | 0.86% |
| 2017-10-03 | TBBK | CWH | n | 8.42 | 8 | 86 | 8.33 | -1.07% | 1.78% |
| 2017-10-04 | AIMT | CWH | n | 25.92 | 26 | 89 | 25.36 | -2.16% | 2.01% |
| 2017-10-05 | OMER | CWH | n | 22.70 | 23 | 97 | 21.48 | -5.37% | 7.71% |
| *RS Rank on day before breakout. | |||||||||
| Symbol | BO Price |
BO Vol. |
Company | Industry | RS Rank |
Last Close |
|---|---|---|---|---|---|---|
| NRG | 26.06 | 8,820,152 | NRG Energy - Inc. Common Stock | Diversified Utilities | 97 | 25.49 |
| GNBC | 24.00 | 332,052 | Green Bancorp - Inc. - Common Stock | Money Center Banks | 94 | 23.25 |
| COHR | 281.00 | 800,916 | Coherent - Inc. - Common Stock | Scientific & Technical Instruments | 94 | 245.09 |
| ARCB | 34.25 | 342,878 | ArcBest Corporation - Common Stock | Trucking | 94 | 32.85 |
| ATSG | 25.91 | 676,028 | Air Transport Services Group - Inc - Common Stock | Air Delivery & Freight Services | 93 | 24.50 |
| MNTX | 9.49 | 95,307 | Manitex International - Inc. - common stock | Diversified Machinery | 92 | 9.11 |
| FONR | 31.85 | 54,780 | Fonar Corporation - Common Stock | Medical Appliances & Equipment | 92 | 30.70 |
| These stocks meet our suggested screening factors
for our Cup and Handle Chart Pattern watchlist. See Revised Rules for Trading Cup and Handle Breakouts |
||||||
| Index | Value | Change Week | Change YTD | Trend1 |
|---|---|---|---|---|
| Dow | -100% | -100% | Up |
|
| NASDAQ | 22405.1 |
244.91% | 316.21% | Up |
| S&P 500 | 6495.96 |
157.84% | 190.15% | Up |
|
1The Market Trend is derived from
our proprietary market model. The market model is described on
the site here.
2The site also shows industry rankings based on fundamentals, combined technical and fundamentals, and on price alone. The site also shows daily industry movements. |
||||
| 1 Week | 13 Weeks | 26 Weeks | Year-to-Date |
|---|---|---|---|
| NASDAQ Composite |
NASDAQ Composite 264.13 % |
NASDAQ Composite 281.18 % |
NASDAQ Composite 316.21 % |
| 1 Week | 3 Weeks | 13 Weeks | 26 Weeks |
|---|---|---|---|
| Aluminum |
Aluminum |
Aluminum |
Aluminum |
| Internet Service Providers 71 |
Appliances 114 |
Manufactured Housing 210 |
Manufactured Housing 209 |
| Charts of each industry rank and performance over 12 months are available on the site | |||
If you received this newsletter from a friend and you would like to receive it regularly please go to the BreakoutWatch.com site and you will then be able to register to receive the newsletter.
Copyright (c) 10/07/2017 NBIcharts, LLC dba BreakoutWatch.com. All
rights reserved.
" BreakoutWatch," the BreakoutWatch.com "eye" logo, and the slogan
"tomorrow's breakouts today" are service marks of NBIcharts LLC. All
other marks are the property of their respective owners, and are used
for descriptive purposes only.
BreakoutWatch is not affiliated with Investor's Business Daily or with Mr. William O'Neil. Our site, research and analysis is supported entirely by subscription and is free from advertising.