Breakoutwatch Weekly Summary 10/28/17
You are receiving this email because you are or were a BreakoutWatch.com subscriber, or have subscribed to our weekly newsletter. This newsletter summarizes the breakout events of the week and provides additional guidance that does not fit into our daily format. It is published each weekend.
| Cup and Handle, Volatility Squeeze
Patterns Dominate Breakouts Until Friday, it seemed likely that the NASDAQ would fail to set another weekly successive new high. That changed on Friday when technology stocks, led by Amazon (AMZN), took the index to a 2.2% gain over Thursday's close. The index closed well above the two standard deviation Bollinger Band. This doesn't necessarily mean that a pull back will be immediate, but certainly suggests there will be some profit taking on Monday. Friday's news that third quarter GDP rose at an annual rate of 3% lifted other sectors too, but briefing.com put the result in perspective, commenting "the headline number was inflated by a change in inventories, while real final sales decelerated to 2.3% from 2.9% in Q2. In other words, the U.S. economy is proceeding largely at the same ho-hum pace." Breakouts jumped to 23 this week from 14 last week. Cup and Handle pattern stocks dominated with 14 breakouts followed by Volatility squeeze pattern stocks with 7. 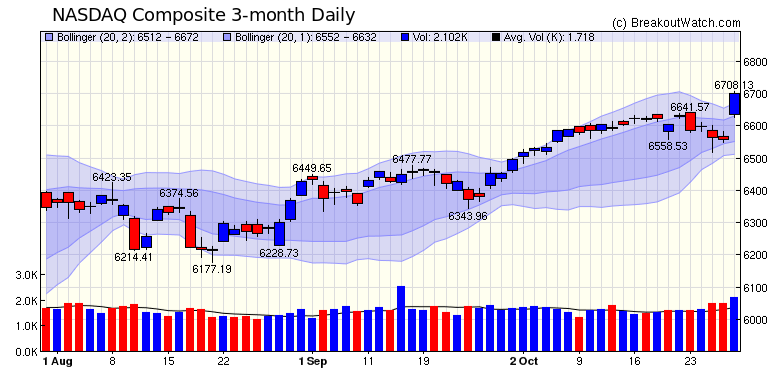 |
| At the request of a subscriber.
I've added a new watchlist filter allowing the selection of
NASDAQ stocks only. While I don't suggest limiting your search
for candidates to just NASDAQ stocks, it is certainly true that
the majority of breakouts come from that exchange. I also fixed a bug in the watchlist chart browser. This allows you to quickly review that charts of stocks selected by your filters and is a useful way to compare possible breakout candidates. There is an example of the chart browser here. |
|
Our latest strategy
suggestions are here.
I noticed that the image showing
my suggested filters was incorrect in the strategy document
and that has been corrected. I also added a reminder that to
limit email alerts to your filters only, you must set your
Account Management > Alert Preferences as follows:
 |
| List | Breakouts | Avg. Gain |
|---|---|---|
| CWH | 14 | 3.39 |
| SQZ | 7 | 4.05 |
| HTF | 0 | |
| HSB | 0 | |
| DB | 2 | 4.31 |
| Brkout Date | Symbol | Base | Squeeze | BrkoutOut Price | Brkout Day Close | RS Rank* | Last Close | Current % off BOP | Gain at Intraday High |
|---|---|---|---|---|---|---|---|---|---|
| 2017-10-25 | HLG | SQZ | y | 19.91 | 22 | 98 | 24.68 | 23.96% | 25.62% |
| 2017-10-25 | GRUB | DB | y | 54.62 | 58 | 87 | 60.02 | 9.89% | 10.82% |
| 2017-10-25 | CHE | CWH | n | 211.79 | 213 | 82 | 232.2 | 9.64% | 10.25% |
| 2017-10-25 | RENN | SQZ | y | 9.50 | 10 | 88 | 10.36 | 9.05% | 10.42% |
| 2017-10-26 | BLKB | CWH | n | 93.95 | 97 | 81 | 102.39 | 8.98% | 9.56% |
| 2017-10-25 | UFI | SQZ | y | 36.46 | 37 | 85 | 38.86 | 6.58% | 7.27% |
| 2017-10-27 | PICO | CWH | n | 18.65 | 20 | 82 | 19.85 | 6.43% | 6.97% |
| 2017-10-25 | ANTM | CWH | n | 199.23 | 206 | 84 | 211.34 | 6.08% | 6.41% |
| 2017-10-25 | GTT | CWH | n | 34.00 | 35 | 84 | 35.55 | 4.56% | 5.15% |
| 2017-10-26 | CACC | CWH | y | 288.23 | 295 | 91 | 299 | 3.74% | 4% |
| 2017-10-26 | BANC | CWH | n | 21.08 | 21 | 81 | 21.7 | 2.94% | 3.8% |
| 2017-10-26 | RDN | CWH | n | 20.82 | 21 | 82 | 21.19 | 1.78% | 3.7% |
| 2017-10-26 | CHH | CWH | n | 68.80 | 70 | 82 | 69.9 | 1.6% | 1.74% |
| 2017-10-27 | RRGB | CWH | y | 68.66 | 70 | 84 | 69.65 | 1.44% | 1.59% |
| 2017-10-27 | NATI | CWH | n | 45.30 | 46 | 89 | 45.88 | 1.28% | 2.27% |
| 2017-10-27 | SC | CWH | y | 15.87 | 16 | 80 | 16.07 | 1.26% | 4.16% |
| 2017-10-27 | DECK | CWH | n | 72.13 | 72 | 80 | 72.49 | 0.5% | 1.83% |
| 2017-10-24 | TMO | SQZ | y | 194.38 | 194 | 83 | 192.42 | -1.01% | 3.51% |
| 2017-10-25 | TMO | SQZ | y | 194.39 | 200 | 83 | 192.42 | -1.01% | 3.5% |
| 2017-10-23 | PVH | DB | y | 128.70 | 130 | 82 | 127.05 | -1.28% | 3.53% |
| 2017-10-25 | MC | CWH | n | 44.00 | 44 | 89 | 42.75 | -2.84% | 3.41% |
| 2017-10-26 | TMO | SQZ | y | 199.68 | 200 | 87 | 192.42 | -3.64% | 0.76% |
| 2017-10-23 | LOGI | SQZ | y | 36.72 | 37 | 86 | 34.66 | -5.61% | 1.36% |
| *RS Rank on day before breakout. | |||||||||
| Symbol | BO Price |
BO Vol. |
Company | Industry | RS Rank |
Last Close |
|---|---|---|---|---|---|---|
| NRG | 26.68 | 8,325,044 | NRG Energy - Inc. Common Stock | Diversified Utilities | 95 | 25.34 |
| MTLS | 16.50 | 85,942 | Materialise NV - American Depositary Shares | Application Software | 94 | 15.15 |
| GNBC | 24.40 | 322,236 | Green Bancorp - Inc. - Common Stock | Money Center Banks | 94 | 23.65 |
| WRLD | 86.32 | 141,897 | World Acceptance Corporation - Common Stock | Credit Services | 94 | 83.35 |
| These stocks meet our suggested screening factors
for our Cup and Handle Chart Pattern watchlist. See Revised Rules for Trading Cup and Handle Breakouts |
||||||
| Index | Value | Change Week | Change YTD | Trend1 |
|---|---|---|---|---|
| Dow | 23434.2 |
0.45% | 18.58% | Up |
| NASDAQ | 6701.26 |
1.09% | 24.49% | Up |
| S&P 500 | 2581.07 |
0.23% | 15.29% | Up |
|
1The Market Trend is derived from
our proprietary market model. The market model is described on
the site here.
2The site also shows industry rankings based on fundamentals, combined technical and fundamentals, and on price alone. The site also shows daily industry movements. |
||||
| 1 Week | 13 Weeks | 26 Weeks | Year-to-Date |
|---|---|---|---|
| NASDAQ Composite |
Dow Jones 7.35 % |
Dow Jones 11.91 % |
NASDAQ Composite 24.49 % |
| 1 Week | 3 Weeks | 13 Weeks | 26 Weeks |
|---|---|---|---|
| Machine Tools & Accessories |
Research Services |
Aluminum |
Aluminum |
| Staffing & Outsourcing Services 55 |
Semiconductor - Memory Chips 141 |
Medical Practitioners 214 |
Medical Practitioners 216 |
| Charts of each industry rank and performance over 12 months are available on the site | |||
If you received this newsletter from a friend and you would like to receive it regularly please go to the BreakoutWatch.com site and you will then be able to register to receive the newsletter.
Copyright (c) 10/28/2017 NBIcharts, LLC dba BreakoutWatch.com. All
rights reserved.
" BreakoutWatch," the BreakoutWatch.com "eye" logo, and the slogan
"tomorrow's breakouts today" are service marks of NBIcharts LLC. All
other marks are the property of their respective owners, and are used
for descriptive purposes only.
BreakoutWatch is not affiliated with Investor's Business Daily or with Mr. William O'Neil. Our site, research and analysis is supported entirely by subscription and is free from advertising.