Breakoutwatch Weekly Summary 12/23/17
You are receiving this email because you are or were a BreakoutWatch.com subscriber, or have subscribed to our weekly newsletter. This newsletter summarizes the breakout events of the week and provides additional guidance that does not fit into our daily format. It is published each weekend.
| EPS Trend Data Available Again This will be the last newsletter of 2017 and I would like to thank all our subscribers for their support this year, and I wish them and all our readers a Merry Christmas and a Healthy and Prosperous New Year. Markets have risen in anticipation of the passing of the Republican Tax Bill and were modestly happy with the final passage as the major indexes continued to set new highs, although at a slightly slower pace as the holidays approached and volumes tapered. After gapping up and setting a new high on Monday, the NASDAQ slipped as investors preferred Industrial, energy and telecom industries over technology and health care. As can be seen in the NASDAQ chart, volumes were below average which restricted the number of breakouts we recognized, as we require volume of at least 1.5 times average volume even if the stock closes above its breakout price for cup and handle pattern stocks. Note also the gains were more modest than usual as the index slipped 0.06% from Monday's close to Friday's. 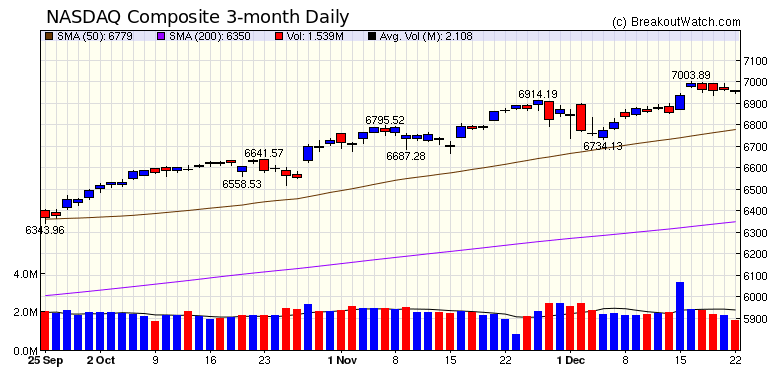 |
| EPS Trend Data Available Again An old feature that suffered from lack of available data was reactivated this weekend after prompting from a new subscriber. EPS Trend data shows how analysts have changed their assessments of the earnings per share for stocks they follow over the last 90 days. The significance of this data is that a rising trend is potentially positive while a negative trend is the opposite. EPS trend data is available under menu choice Evaluate > Analytical Tools > EPS Trends. This data can be searched for all stocks meeting certain minimum EPS values, or for individual stocks. The image below shows how analysts assessments have changed over the last 90 days for Amazon (AMZN) and Apple (AAPL) stocks. 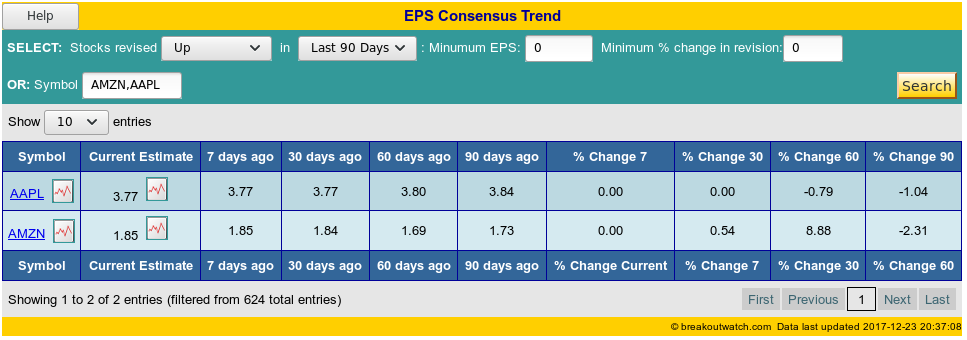 EPS trend data is refreshed
each weekend. The latest data is currently being loaded and
should be complete by Sunday.
|
|
Our latest strategy
suggestions are here.
These strategy suggestions are under review following their under-performance in 2017 compared to 2016. I hope to publish new suggestions in the first newsletter of the New Year. |
| List | Breakouts | Avg. Gain |
|---|---|---|
| CWH | 10 | 2.01 |
| SQZ | 6 | -1.02 |
| HTF | 0 | |
| HSB | 0 | |
| DB | 1 | -1.36 |
| Brkout Date | Symbol | Base | Squeeze | BrkoutOut Price | Brkout Day Close | RS Rank* | Last Close | Current % off BOP | Gain at Intraday High |
|---|---|---|---|---|---|---|---|---|---|
| 2017-12-22 | SXC | CWH | y | 11.63 | 12 | 80 | 12.17 | 4.64% | 5.33% |
| 2017-12-21 | MVO | CWH | n | 7.54 | 8 | 88 | 7.88 | 4.51% | 7.16% |
| 2017-12-18 | PXLW | CWH | n | 6.18 | 6 | 93 | 6.45 | 4.37% | 5.66% |
| 2017-12-20 | ASND | CWH | y | 38.50 | 39 | 93 | 39.47 | 2.52% | 5.14% |
| 2017-12-21 | WETF | CWH | n | 12.38 | 12 | 83 | 12.66 | 2.26% | 2.42% |
| 2017-12-22 | CORT | SQZ | y | 17.52 | 18 | 92 | 17.89 | 2.11% | 3.03% |
| 2017-12-18 | CHGG | CWH | n | 16.00 | 16 | 93 | 16.29 | 1.81% | 4.19% |
| 2017-12-21 | KND | CWH | n | 9.50 | 10 | 85 | 9.65 | 1.58% | 6.84% |
| 2017-12-18 | RPD | SQZ | y | 18.89 | 19 | 82 | 19.09 | 1.06% | 5.66% |
| 2017-12-18 | BR | SQZ | y | 90.04 | 91 | 82 | 90.95 | 1.01% | 2.67% |
| 2017-12-21 | KIN | CWH | n | 8.35 | 8 | 82 | 8.4 | 0.6% | 1.8% |
| 2017-12-18 | UBNT | CWH | n | 68.14 | 70 | 82 | 68.45 | 0.45% | 4.24% |
| 2017-12-21 | SPAR | SQZ | y | 17.16 | 18 | 97 | 17.2 | 0.23% | 5.48% |
| 2017-12-19 | MGPI | SQZ | y | 74.84 | 78 | 90 | 73.97 | -1.16% | 5.18% |
| 2017-12-19 | JD | DB | n | 42.77 | 43 | 75 | 42.19 | -1.36% | 1.66% |
| 2017-12-18 | AVAV | CWH | n | 58.23 | 59 | 95 | 56.67 | -2.68% | 1.31% |
| 2017-12-20 | CAMP | SQZ | y | 23.22 | 23 | 84 | 21.05 | -9.35% | 3.32% |
| *RS Rank on day before breakout. | |||||||||
| Symbol | BO Price |
BO Vol. |
Company | Industry | RS Rank |
Last Close |
|---|---|---|---|---|---|---|
| SORL | 8.45 | 1,079,196 | SORL Auto Parts - Inc. - Common Stock | Auto Manufacturers - Major | 97 | 7.34 |
| CYRX | 9.15 | 194,034 | CryoPort - Inc. - Common Stock | Packaging & Containers | 96 | 8.83 |
| BOOM | 23.30 | 91,082 | DMC Global Inc. - Common Stock | Metal Fabrication | 94 | 22.10 |
| PETS | 49.04 | 1,043,841 | PetMed Express - Inc. - Common Stock | Drug Delivery | 94 | 45.64 |
| These stocks meet our suggested screening factors
for our Cup and Handle Chart Pattern watchlist. See Revised Rules for Trading Cup and Handle Breakouts |
||||||
| Index | Value | Change Week | Change YTD | Trend1 |
|---|---|---|---|---|
| Dow | 24754.1 |
0.42% | 25.26% | Up |
| NASDAQ | 6959.96 |
0.34% | 29.29% | Up |
| S&P 500 | 2683.34 |
0.28% | 19.85% | Up |
|
1The Market Trend is derived from
our proprietary market model. The market model is described on
the site here.
2The site also shows industry rankings based on fundamentals, combined technical and fundamentals, and on price alone. The site also shows daily industry movements. |
||||
| 1 Week | 13 Weeks | 26 Weeks | Year-to-Date |
|---|---|---|---|
| Dow Jones |
Dow Jones 10.76 % |
Dow Jones 15.7 % |
NASDAQ Composite 29.29 % |
| 1 Week | 3 Weeks | 13 Weeks | 26 Weeks |
|---|---|---|---|
| Auto Parts Wholesale |
Auto Parts Wholesale |
Recreational Vehicles |
Aluminum |
| Industrial Equipment Wholesale 35 |
Regional Airlines 84 |
Wholesale - Other 215 |
Personal Computers 215 |
| Charts of each industry rank and performance over 12 months are available on the site | |||
If you received this newsletter from a friend and you would like to receive it regularly please go to the BreakoutWatch.com site and you will then be able to register to receive the newsletter.
Copyright (c) 12/23/2017 NBIcharts, LLC dba BreakoutWatch.com. All
rights reserved.
" BreakoutWatch," the BreakoutWatch.com "eye" logo, and the slogan
"tomorrow's breakouts today" are service marks of NBIcharts LLC. All
other marks are the property of their respective owners, and are used
for descriptive purposes only.
BreakoutWatch is not affiliated with Investor's Business Daily or with Mr. William O'Neil. Our site, research and analysis is supported entirely by subscription and is free from advertising.