Breakoutwatch Weekly Summary 01/20/18
You are receiving this email because you are or were a BreakoutWatch.com subscriber, or have subscribed to our weekly newsletter. This newsletter summarizes the breakout events of the week and provides additional guidance that does not fit into our daily format. It is published each weekend.
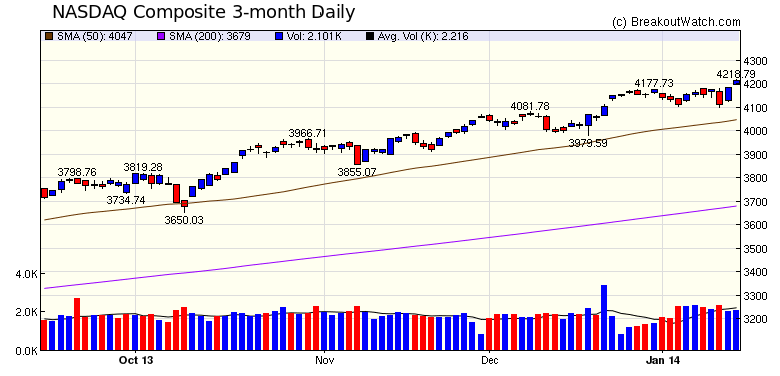 The government shutdown is unlikely to have a major effect on the markets. During the last shutdown in 2013 the NASDAQ came out even while the S&P 500 gained 3.1%. Of our two suggested strategies, the Buy at Open has performed the best so far. Buy on Alert Trades This Year*
Buy at Open Trades this Year*
|
||||||||||||||||||||||||||||||||||||||||||||||||||||||||||||||||||||||||
| No new features this week. |
|
Our latest strategy
suggestions are here.
|
| List | Breakouts | Avg. Gain |
|---|---|---|
| CWH | 27 | 2.66 |
| SQZ | 55 | 3.58 |
| HTF | 0 | |
| HSB | 0 | |
| DB | 2 | 0.6 |
| Brkout Date | Symbol | Base | Squeeze | BrkoutOut Price | Brkout Day Close | RS Rank* | Last Close | Current % off BOP | Gain at Intraday High |
|---|---|---|---|---|---|---|---|---|---|
| 2018-01-17 | CVGI | SQZ | y | 11.45 | 12.79 | 95 | 12.92 | 12.84% | 19.3% |
| 2018-01-16 | ASML | CWH | n | 184.46 | 186.38 | 82 | 205.52 | 11.42% | 11.69% |
| 2018-01-16 | ORBK | SQZ | y | 51.10 | 51.47 | 89 | 56.31 | 10.2% | 11.1% |
| 2018-01-17 | ORBK | SQZ | y | 51.48 | 54.1 | 81 | 56.31 | 9.38% | 10.28% |
| 2018-01-17 | NEOS | SQZ | y | 10.51 | 11.2 | 91 | 11.4 | 8.47% | 9.42% |
| 2018-01-18 | YRCW | CWH | n | 15.80 | 16.29 | 83 | 17.01 | 7.66% | 8.1% |
| 2018-01-19 | NYT | CWH | n | 20.35 | 21.9 | 80 | 21.9 | 7.62% | 8.01% |
| 2018-01-18 | HIIQ | SQZ | y | 25.96 | 26.6 | 81 | 27.9 | 7.47% | 7.86% |
| 2018-01-16 | ADMS | SQZ | y | 35.59 | 35.74 | 97 | 38.19 | 7.31% | 8.88% |
| 2018-01-16 | WNS | SQZ | y | 41.11 | 41.45 | 83 | 44.08 | 7.22% | 11.89% |
| 2018-01-16 | TSG | SQZ | y | 23.56 | 24.25 | 87 | 25.25 | 7.17% | 8.02% |
| 2018-01-17 | ANF | SQZ | y | 18.60 | 18.82 | 97 | 19.92 | 7.1% | 7.96% |
| 2018-01-16 | YNDX | CWH | n | 34.89 | 35.18 | 85 | 37.2 | 6.62% | 8.03% |
| 2018-01-16 | WB | CWH | n | 122.21 | 123.19 | 96 | 130.29 | 6.61% | 8.42% |
| 2018-01-16 | UNH | SQZ | y | 228.65 | 232.9 | 84 | 243.35 | 6.43% | 6.87% |
| 2018-01-19 | LOXO | CWH | y | 91.21 | 96.83 | 94 | 96.83 | 6.16% | 7.44% |
| 2018-01-18 | ANF | SQZ | y | 18.83 | 18.92 | 95 | 19.92 | 5.79% | 6.64% |
| 2018-01-18 | APPF | SQZ | y | 42.66 | 42.7 | 85 | 44.95 | 5.37% | 5.49% |
| 2018-01-19 | ANF | SQZ | y | 18.93 | 19.92 | 95 | 19.92 | 5.23% | 6.08% |
| 2018-01-17 | KR | SQZ | y | 28.26 | 28.67 | 92 | 29.72 | 5.17% | 5.52% |
| 2018-01-16 | SFM | SQZ | y | 25.48 | 25.75 | 83 | 26.65 | 4.59% | 5.89% |
| 2018-01-17 | VRTU | SQZ | y | 46.03 | 47.62 | 84 | 48.01 | 4.3% | 4.93% |
| 2018-01-17 | TSG | SQZ | y | 24.26 | 24.95 | 83 | 25.25 | 4.08% | 4.91% |
| 2018-01-18 | ORBK | SQZ | y | 54.11 | 55.83 | 91 | 56.31 | 4.07% | 4.92% |
| 2018-01-18 | CYD | SQZ | y | 25.82 | 26.01 | 89 | 26.87 | 4.07% | 4.92% |
| 2018-01-17 | COHR | SQZ | y | 306.28 | 321.92 | 81 | 318.35 | 3.94% | 7.42% |
| 2018-01-19 | BAK | CWH | n | 30.80 | 32.01 | 81 | 32.01 | 3.93% | 4.09% |
| 2018-01-18 | UPLD | SQZ | y | 22.67 | 22.69 | 90 | 23.55 | 3.88% | 4.59% |
| 2018-01-16 | SGMS | SQZ | y | 53.86 | 54.1 | 97 | 55.88 | 3.75% | 3.79% |
| 2018-01-19 | UPLD | SQZ | y | 22.70 | 23.55 | 91 | 23.55 | 3.74% | 4.45% |
| 2018-01-17 | SFM | SQZ | y | 25.76 | 25.96 | 93 | 26.65 | 3.45% | 4.74% |
| 2018-01-18 | CALD | SQZ | y | 29.86 | 30.4 | 88 | 30.85 | 3.32% | 3.58% |
| 2018-01-19 | CYD | SQZ | y | 26.02 | 26.87 | 90 | 26.87 | 3.27% | 4.11% |
| 2018-01-18 | AXTI | SQZ | y | 8.96 | 9.2 | 81 | 9.25 | 3.24% | 4.41% |
| 2018-01-19 | NBN | SQZ | y | 24.16 | 24.9 | 82 | 24.9 | 3.06% | 3.27% |
| 2018-01-19 | INBK | SQZ | y | 40.16 | 41.35 | 85 | 41.35 | 2.96% | 4.28% |
| 2018-01-19 | DYN | CWH | n | 12.23 | 12.59 | 89 | 12.59 | 2.94% | 3.19% |
| 2018-01-18 | PII | SQZ | y | 130.98 | 132.26 | 91 | 134.7 | 2.84% | 3.21% |
| 2018-01-16 | BCO | SQZ | y | 83.81 | 84 | 86 | 85.85 | 2.43% | 2.61% |
| 2018-01-19 | ARCB | SQZ | y | 36.96 | 37.85 | 88 | 37.85 | 2.41% | 3.49% |
| 2018-01-18 | GDOT | SQZ | y | 61.09 | 61.28 | 94 | 62.47 | 2.26% | 2.26% |
| 2018-01-19 | EXTR | SQZ | y | 13.50 | 13.8 | 94 | 13.8 | 2.22% | 2.37% |
| 2018-01-17 | WMT | CWH | n | 102.35 | 102.7 | 81 | 104.59 | 2.19% | 2.53% |
| 2018-01-18 | ITT | SQZ | y | 55.09 | 55.31 | 83 | 56.28 | 2.16% | 2.2% |
| 2018-01-17 | TER | CWH | n | 46.48 | 46.76 | 81 | 47.42 | 2.02% | 2.67% |
| 2018-01-19 | GDOT | SQZ | y | 61.29 | 62.47 | 94 | 62.47 | 1.93% | 1.93% |
| 2018-01-19 | CAMT | CWH | n | 6.92 | 7.05 | 94 | 7.05 | 1.88% | 3.47% |
| 2018-01-19 | PII | SQZ | y | 132.27 | 134.7 | 91 | 134.7 | 1.84% | 2.2% |
| 2018-01-19 | STAA | SQZ | y | 15.91 | 16.2 | 91 | 16.2 | 1.82% | 1.82% |
| 2018-01-19 | JOUT | SQZ | y | 62.62 | 63.76 | 86 | 63.76 | 1.82% | 4.44% |
| 2018-01-19 | ADMS | SQZ | y | 37.51 | 38.19 | 97 | 38.19 | 1.81% | 2.05% |
| 2018-01-19 | CRCM | CWH | n | 19.62 | 19.96 | 92 | 19.96 | 1.73% | 3.41% |
| 2018-01-19 | CC | CWH | n | 53.15 | 54.02 | 84 | 54.02 | 1.64% | 1.88% |
| 2018-01-19 | ALG | CWH | y | 116.72 | 118.43 | 83 | 118.43 | 1.47% | 1.8% |
| 2018-01-19 | ITT | CWH | y | 55.49 | 56.28 | 83 | 56.28 | 1.42% | 1.46% |
| 2018-01-18 | NC | SQZ | y | 41.41 | 41.95 | 96 | 42 | 1.42% | 2.49% |
| 2018-01-19 | PHM | SQZ | y | 34.16 | 34.6 | 90 | 34.6 | 1.29% | 1.29% |
| 2018-01-19 | LYV | SQZ | y | 43.20 | 43.7 | 80 | 43.7 | 1.16% | 1.2% |
| 2018-01-19 | LII | SQZ | y | 214.00 | 216.48 | 81 | 216.48 | 1.16% | 1.3% |
| 2018-01-19 | NVDA | CWH | n | 227.51 | 230.11 | 95 | 230.11 | 1.14% | 1.57% |
| 2018-01-19 | SPWR | SQZ | y | 8.56 | 8.65 | 81 | 8.65 | 1.05% | 1.52% |
| 2018-01-19 | VRTU | SQZ | y | 47.54 | 48.01 | 92 | 48.01 | 0.99% | 1.03% |
| 2018-01-19 | WIFI | SQZ | y | 22.66 | 22.88 | 90 | 22.88 | 0.97% | 0.97% |
| 2018-01-19 | STMP | SQZ | y | 195.41 | 197.25 | 85 | 197.25 | 0.94% | 2.32% |
| 2018-01-16 | COLL | SQZ | y | 20.03 | 21.13 | 95 | 20.21 | 0.9% | 7.34% |
| 2018-01-16 | JOBS | CWH | n | 66.41 | 66.63 | 88 | 67 | 0.89% | 2.85% |
| 2018-01-19 | TDF | CWH | n | 23.48 | 23.68 | 81 | 23.68 | 0.85% | 0.85% |
| 2018-01-18 | NVMI | SQZ | y | 27.88 | 28.04 | 86 | 28.1 | 0.79% | 1.33% |
| 2018-01-19 | VRNS | CWH | n | 53.85 | 54.25 | 92 | 54.25 | 0.74% | 2.47% |
| 2018-01-19 | CLUB | SQZ | y | 6.01 | 6.05 | 91 | 6.05 | 0.67% | 3.16% |
| 2018-01-19 | VAC | CWH | y | 138.42 | 139.3 | 84 | 139.3 | 0.64% | 1.13% |
| 2018-01-19 | SBAC | DB | n | 164.74 | 165.79 | 80 | 165.79 | 0.64% | 0.75% |
| 2018-01-19 | GES | CWH | n | 18.11 | 18.22 | 86 | 18.22 | 0.61% | 0.77% |
| 2018-01-19 | XYL | CWH | n | 71.49 | 71.91 | 84 | 71.91 | 0.59% | 5.13% |
| 2018-01-19 | KELYA | DB | y | 29.17 | 29.33 | 78 | 29.33 | 0.55% | 1.58% |
| 2018-01-19 | AXTI | SQZ | y | 9.21 | 9.25 | 83 | 9.25 | 0.43% | 1.57% |
| 2018-01-19 | CDNS | CWH | n | 45.41 | 45.6 | 85 | 45.6 | 0.42% | 0.73% |
| 2018-01-19 | AZO | CWH | n | 791.64 | 793.8 | 81 | 793.8 | 0.27% | 0.79% |
| 2018-01-16 | MODN | SQZ | y | 15.91 | 15.95 | 86 | 15.95 | 0.25% | 4.34% |
| 2018-01-19 | ANGI | CWH | n | 13.22 | 13.25 | 91 | 13.25 | 0.23% | 1.29% |
| 2018-01-19 | NVMI | SQZ | y | 28.05 | 28.1 | 87 | 28.1 | 0.18% | 0.71% |
| 2018-01-19 | NC | SQZ | y | 41.96 | 42 | 96 | 42 | 0.1% | 1.14% |
| 2018-01-19 | MTRN | CWH | n | 53.65 | 53.7 | 87 | 53.7 | 0.09% | 0.5% |
| 2018-01-19 | CALD | CWH | y | 30.84 | 30.85 | 89 | 30.85 | 0.03% | 0.29% |
| *RS Rank on day before breakout. | |||||||||
| Symbol | BO Price |
BO Vol. |
Company | Industry | RS Rank |
Last Close |
|---|---|---|---|---|---|---|
| FENG | 7.42 | 1,101,552 | Phoenix New Media Limited American Depositary Shar | Internet Information Providers | 96 | 7.10 |
| BZUN | 38.48 | 3,596,234 | Baozun Inc. - American Depositary Shares | Catalog & Mail Order Houses | 95 | 36.55 |
| PNK | 33.63 | 1,206,933 | Pinnacle Entertainment - Inc. - Common Stock | Resorts & Casinos | 95 | 33.38 |
| TGH | 24.95 | 379,146 | Textainer Group Holdings Limited Common Shares | Rental & Leasing Services | 95 | 24.25 |
| TTWO | 120.18 | 3,413,214 | Take-Two Interactive Software - Inc. - Common Stock | Multimedia & Graphics Software | 94 | 118.05 |
| These stocks meet our suggested screening factors
for our Cup and Handle Chart Pattern watchlist. See Revised Rules for Trading Cup and Handle Breakouts |
||||||
| Index | Value | Change Week | Change YTD | Trend1 |
|---|---|---|---|---|
| Dow | 26018 |
0.83% | 5.25% | Up |
| NASDAQ | 7296 |
0.48% | 5.69% | Up |
| S&P 500 | 2798 |
0.42% | 4.65% | Up |
|
1The Market Trend is derived from
our proprietary market model. The market model is described on
the site here.
2The site also shows industry rankings based on fundamentals, combined technical and fundamentals, and on price alone. The site also shows daily industry movements. |
||||
| 1 Week | 13 Weeks | 26 Weeks | Year-to-Date |
|---|---|---|---|
| Dow Jones |
Dow Jones 11.53 % |
Dow Jones 20.56 % |
NASDAQ Composite 5.69 % |
| 1 Week | 3 Weeks | 13 Weeks | 26 Weeks |
|---|---|---|---|
| Auto Parts Wholesale |
Auto Parts Wholesale |
Auto Parts Wholesale |
Aluminum |
| Aerospace/Defense - Major Diversified 122 |
Auto Parts Stores 125 |
Auto Parts Stores 168 |
Medical Practitioners 215 |
| Charts of each industry rank and performance over 12 months are available on the site | |||
If you received this newsletter from a friend and you would like to receive it regularly please go to the BreakoutWatch.com site and you will then be able to register to receive the newsletter.
Copyright (c) 01/20/2018 NBIcharts, LLC dba BreakoutWatch.com. All
rights reserved.
" BreakoutWatch," the BreakoutWatch.com "eye" logo, and the slogan
"tomorrow's breakouts today" are service marks of NBIcharts LLC. All
other marks are the property of their respective owners, and are used
for descriptive purposes only.
BreakoutWatch is not affiliated with Investor's Business Daily or with Mr. William O'Neil. Our site, research and analysis is supported entirely by subscription and is free from advertising.