Breakoutwatch Weekly Summary 02/24/18
You are receiving this email because you are or were a BreakoutWatch.com subscriber, or have subscribed to our weekly newsletter. This newsletter summarizes the breakout events of the week and provides additional guidance that does not fit into our daily format. It is published each weekend.
| Trend Indicators Turn Positive
Although Volumes Remain Below Average Our market trend indicators turned positive on Thursday. This may seem strange considering the indexes moved sideways and slightly down after Monday's holiday but the explanation is that the trend indicator is necessarily a lagging indicator which can take up to 5 days to register a change in trend. This lag prevents false signals. The market continues to be notable for volume levels that are below average indicating that doubts about the future market direction remain. These doubts may have been alleviated somewhat by the release of the Fed's Monetary Policy Report on Friday which reinforced expectations of a gradual rise in interest rates this year. The markets moved higher Friday afternoon following the release of this report. There continues to be a drop in the number of stocks qualifying as a cup and handle pattern with a consequent reduction in the number of cup and handle (CWH) breakouts. The number of Volatility Squeeze breakouts is on the increase, though, with several scoring big gains this week. 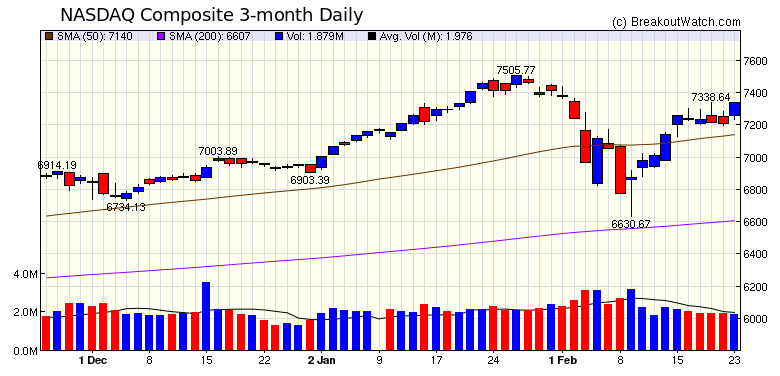 |
| A bug in the watchlist display which prevented update of filters on all watchlists other than cup and handle has been corrected. |
|
Our latest strategy
suggestions are here.
|
| List | Breakouts | Avg. Gain |
|---|---|---|
| CWH | 5 | 1.76 |
| SQZ | 35 | 3.21 |
| HTF | 0 | |
| HSB | 0 | |
| DB | 3 | 6 |
| Brkout Date | Symbol | Base | Squeeze | BrkoutOut Price | Brkout Day Close | RS Rank* | Last Close | Current % off BOP | Gain at Intraday High |
|---|---|---|---|---|---|---|---|---|---|
| 2018-02-20 | PAR | SQZ | y | 10.00 | 11.26 | 85 | 11.56 | 15.6% | 19.4% |
| 2018-02-21 | WATT | SQZ | y | 19.92 | 20.02 | 97 | 22.44 | 12.65% | 14.31% |
| 2018-02-23 | WATT | SQZ | y | 19.94 | 22.44 | 96 | 22.44 | 12.54% | 14.19% |
| 2018-02-21 | LPSN | DB | n | 12.75 | 14.35 | 71 | 14.25 | 11.76% | 17.25% |
| 2018-02-22 | GSVC | SQZ | y | 6.88 | 6.92 | 87 | 7.62 | 10.76% | 11.34% |
| 2018-02-22 | LOPE | DB | y | 95.49 | 99.72 | 77 | 101.79 | 6.6% | 7.62% |
| 2018-02-20 | DAVE | SQZ | y | 6.46 | 6.7 | 91 | 6.85 | 6.04% | 11.46% |
| 2018-02-21 | TGTX | CWH | n | 13.25 | 13.85 | 92 | 14.05 | 6.04% | 9.43% |
| 2018-02-22 | SQM | SQZ | y | 55.19 | 56.47 | 88 | 58.39 | 5.8% | 5.82% |
| 2018-02-20 | ZGNX | SQZ | y | 41.26 | 41.85 | 98 | 43.45 | 5.31% | 7.97% |
| 2018-02-20 | MU | SQZ | y | 44.22 | 44.9 | 90 | 46.53 | 5.22% | 5.83% |
| 2018-02-21 | URBN | SQZ | y | 35.24 | 35.54 | 95 | 37.05 | 5.14% | 5.25% |
| 2018-02-22 | TESS | SQZ | y | 23.21 | 23.88 | 95 | 24.4 | 5.13% | 6.89% |
| 2018-02-20 | RST | SQZ | y | 13.38 | 13.63 | 90 | 13.91 | 3.96% | 4.48% |
| 2018-02-21 | ZGNX | SQZ | y | 41.86 | 43 | 98 | 43.45 | 3.8% | 6.43% |
| 2018-02-21 | AEO | SQZ | y | 18.45 | 18.93 | 94 | 19.15 | 3.79% | 4.23% |
| 2018-02-20 | FBR | CWH | n | 18.03 | 19.25 | 94 | 18.7 | 3.72% | 8.71% |
| 2018-02-23 | SQM | SQZ | y | 56.48 | 58.39 | 90 | 58.39 | 3.38% | 3.4% |
| 2018-02-20 | DPZ | CWH | n | 221.92 | 222.11 | 80 | 228.85 | 3.12% | 6.34% |
| 2018-02-20 | DVAX | SQZ | y | 17.23 | 17.25 | 97 | 17.75 | 3.02% | 7.37% |
| 2018-02-21 | DVAX | SQZ | y | 17.26 | 17.4 | 95 | 17.75 | 2.84% | 4.87% |
| 2018-02-23 | TESS | SQZ | y | 23.89 | 24.4 | 95 | 24.4 | 2.13% | 3.85% |
| 2018-02-21 | DAVE | SQZ | y | 6.71 | 6.8 | 94 | 6.85 | 2.09% | 7.3% |
| 2018-02-23 | ALDX | SQZ | y | 7.46 | 7.6 | 93 | 7.6 | 1.88% | 2.55% |
| 2018-02-23 | URBN | CWH | n | 36.49 | 37.05 | 93 | 37.05 | 1.53% | 1.64% |
| 2018-02-23 | AEO | SQZ | y | 18.87 | 19.15 | 93 | 19.15 | 1.48% | 1.91% |
| 2018-02-20 | ARA | SQZ | y | 19.47 | 19.64 | 86 | 19.7 | 1.18% | 3.75% |
| 2018-02-23 | SEM | SQZ | y | 18.46 | 18.65 | 80 | 18.65 | 1.03% | 4.55% |
| 2018-02-20 | GPRK | SQZ | y | 9.96 | 10.09 | 88 | 10.04 | 0.8% | 5.72% |
| 2018-02-22 | SSNC | SQZ | y | 50.12 | 50.16 | 88 | 50.49 | 0.74% | 1.06% |
| 2018-02-20 | HOLI | SQZ | y | 25.64 | 25.88 | 85 | 25.81 | 0.66% | 3.82% |
| 2018-02-23 | SSNC | SQZ | y | 50.17 | 50.49 | 88 | 50.49 | 0.64% | 0.96% |
| 2018-02-20 | AIN | SQZ | y | 65.86 | 65.95 | 84 | 66.25 | 0.59% | 1.96% |
| 2018-02-21 | AIN | SQZ | y | 65.96 | 66 | 83 | 66.25 | 0.44% | 1.73% |
| 2018-02-21 | ARA | SQZ | y | 19.65 | 19.8 | 92 | 19.7 | 0.25% | 2.8% |
| 2018-02-22 | HALO | SQZ | y | 19.25 | 19.28 | 89 | 19.28 | 0.16% | 4.05% |
| 2018-02-21 | CBH | SQZ | y | 9.21 | 9.28 | 99 | 9.19 | -0.22% | 0.98% |
| 2018-02-21 | HOLI | SQZ | y | 25.89 | 26.02 | 85 | 25.81 | -0.31% | 2.82% |
| 2018-02-21 | BPMC | DB | y | 88.35 | 88.87 | 96 | 88.02 | -0.37% | 4.7% |
| 2018-02-20 | PODD | SQZ | y | 76.74 | 77.63 | 93 | 75.55 | -1.55% | 8.89% |
| 2018-02-22 | KELYA | SQZ | y | 30.25 | 30.27 | 81 | 29.71 | -1.79% | 1.52% |
| 2018-02-21 | PODD | SQZ | y | 77.64 | 77.74 | 91 | 75.55 | -2.69% | 7.62% |
| 2018-02-22 | CCXI | CWH | y | 10.13 | 10.27 | 91 | 9.56 | -5.63% | 3.65% |
| *RS Rank on day before breakout. | |||||||||
| Symbol | BO Price |
BO Vol. |
Company | Industry | RS Rank |
Last Close |
|---|---|---|---|---|---|---|
| CYRX | 9.26 | 136,464 | CryoPort - Inc. - Common Stock | Packaging & Containers | 96 | 8.17 |
| BZUN | 39.98 | 2,485,382 | Baozun Inc. - American Depositary Shares | Catalog & Mail Order Houses | 95 | 36.55 |
| These stocks meet our suggested screening factors
for our Cup and Handle Chart Pattern watchlist. See Revised Rules for Trading Cup and Handle Breakouts |
||||||
| Index | Value | Change Week | Change YTD | Trend1 |
|---|---|---|---|---|
| Dow | 25310 |
0.36% | 2.39% | Up |
| NASDAQ | 7337.39 |
1.35% | 6.29% | Up |
| S&P 500 | 2747.3 |
0.55% | 2.76% | Up |
|
1The Market Trend is derived from
our proprietary market model. The market model is described on
the site here.
2The site also shows industry rankings based on fundamentals, combined technical and fundamentals, and on price alone. The site also shows daily industry movements. |
||||
| 1 Week | 13 Weeks | 26 Weeks | Year-to-Date |
|---|---|---|---|
| NASDAQ Composite |
Dow Jones 6.51 % |
NASDAQ Composite 17.11 % |
NASDAQ Composite 6.29 % |
| 1 Week | 3 Weeks | 13 Weeks | 26 Weeks |
|---|---|---|---|
| Resorts & Casinos |
Resorts & Casinos |
Auto Parts Wholesale |
Resorts & Casinos |
| Home Health Care 78 |
Advertising Agencies 152 |
Advertising Agencies 152 |
Wholesale - Other 214 |
| Charts of each industry rank and performance over 12 months are available on the site | |||
If you received this newsletter from a friend and you would like to receive it regularly please go to the BreakoutWatch.com site and you will then be able to register to receive the newsletter.
Copyright (c) 02/24/2018 NBIcharts, LLC dba BreakoutWatch.com. All
rights reserved.
" BreakoutWatch," the BreakoutWatch.com "eye" logo, and the slogan
"tomorrow's breakouts today" are service marks of NBIcharts LLC. All
other marks are the property of their respective owners, and are used
for descriptive purposes only.
BreakoutWatch is not affiliated with Investor's Business Daily or with Mr. William O'Neil. Our site, research and analysis is supported entirely by subscription and is free from advertising.