Breakoutwatch Weekly Summary 04/21/18
You are receiving this email because you are or were a BreakoutWatch.com subscriber, or have subscribed to our weekly newsletter. This newsletter summarizes the breakout events of the week and provides additional guidance that does not fit into our daily format. It is published each weekend.
| Trend Signals Reverse and NASDAQ
Threatens a Correction The week started well with all three major indexes showing gains on improving volume. This was sufficient to turn our trend signals positive on Wednesday for all three major indexes. The trend indicators had been pointing down since April 22. The positive reading was short-lived, however, and losses on Thursday and Friday returned the trend signals to a negative position. Market analysts attributed the decline to fears of inflation as the yield on the 10-year Treasury note reached a more-than-four-year high. Rising treasury yields are an indicator of rising inflation, and therefore lower real returns for stocks. Although the NASDAQ made a modest gain of 0.6% for the week, the index closed below its 50 day moving average, a bearish signal. This view could be reinforced by the index also showing signs of developing a Head and Shoulders Top pattern (HST). The neckline is sloping upwards meaning that the pattern will be completed when the price drops to the right neck low, which is 6811. This would signal a potential for the index to fall a further 800 points. You can read about the HST pattern here. 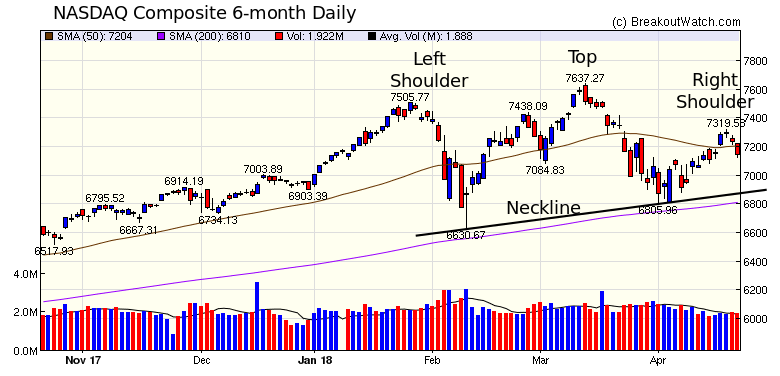 |
| No new features this week. |
|
Our latest strategy
suggestions are here.
To see stocks in a Head and Shoulders Top pattern, go to menu choice 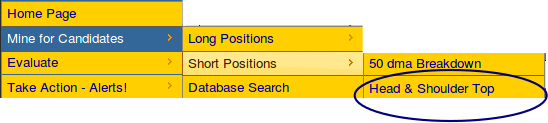 |
| List | Breakouts | Avg. Gain |
|---|---|---|
| CWH | 7 | -0.37 |
| SQZ | 19 | 3.16 |
| HTF | 0 | |
| HSB | 0 | |
| DB | 4 | 3.08 |
| Brkout Date | Symbol | Base | Squeeze | BrkoutOut Price | Brkout Day Close | RS Rank* | Last Close | Current % off BOP | Gain at Intraday High |
|---|---|---|---|---|---|---|---|---|---|
| 2018-04-17 | IIN | SQZ | y | 19.61 | 23.7 | 96 | 23.4 | 19.33% | 22.9% |
| 2018-04-17 | JAX | SQZ | y | 11.71 | 12.15 | 85 | 12.75 | 8.88% | 5.47% |
| 2018-04-17 | BBX | SQZ | y | 9.30 | 9.38 | 87 | 10 | 7.53% | 6.99% |
| 2018-04-18 | BBX | SQZ | y | 9.39 | 10.01 | 88 | 10 | 6.5% | 5.96% |
| 2018-04-17 | BCOR | SQZ | y | 25.16 | 26.25 | 80 | 26.75 | 6.32% | 5.8% |
| 2018-04-17 | APPF | DB | n | 45.75 | 46.65 | 76 | 48.5 | 6.01% | 6.01% |
| 2018-04-16 | WING | SQZ | y | 48.29 | 51.09 | 93 | 50.76 | 5.11% | 5.57% |
| 2018-04-18 | SGMS | DB | n | 47.90 | 49.5 | 91 | 50 | 4.38% | 3.17% |
| 2018-04-16 | FARO | DB | n | 61.00 | 64 | 94 | 63.45 | 4.02% | 3.69% |
| 2018-04-18 | FSLR | SQZ | y | 72.69 | 77.58 | 96 | 75.51 | 3.88% | 3.54% |
| 2018-04-16 | CW | SQZ | y | 137.57 | 139.47 | 89 | 142.03 | 3.24% | 2.63% |
| 2018-04-16 | HOME | CWH | n | 34.02 | 35.1 | 94 | 35 | 2.88% | 4.12% |
| 2018-04-18 | EC | CWH | n | 21.36 | 21.72 | 97 | 21.94 | 2.72% | 1.73% |
| 2018-04-19 | GTLS | SQZ | y | 60.49 | 61.18 | 94 | 61.94 | 2.4% | 0.79% |
| 2018-04-17 | BLFS | CWH | n | 7.19 | 7.52 | 96 | 7.33 | 1.95% | 1.95% |
| 2018-04-16 | ROL | SQZ | y | 51.31 | 52.64 | 84 | 52.16 | 1.66% | 3.45% |
| 2018-04-18 | OLBK | SQZ | y | 33.64 | 33.86 | 81 | 34.18 | 1.61% | 1.1% |
| 2018-04-19 | OLBK | SQZ | y | 33.87 | 34.23 | 82 | 34.18 | 0.92% | 0.41% |
| 2018-04-16 | DST | SQZ | y | 83.68 | 83.99 | 88 | 83.99 | 0.37% | 0.26% |
| 2018-04-17 | ULTI | SQZ | y | 243.95 | 249.01 | 83 | 244.67 | 0.3% | 1.68% |
| 2018-04-18 | STO | CWH | n | 25.58 | 26.18 | 89 | 25.6 | 0.08% | 1.37% |
| 2018-04-18 | SNE | SQZ | y | 49.79 | 50.46 | 86 | 49.76 | -0.06% | 0.94% |
| 2018-04-19 | GWW | CWH | n | 289.30 | 299.88 | 92 | 288.4 | -0.31% | 0.76% |
| 2018-04-17 | EHIC | CWH | n | 13.12 | 13.3 | 85 | 13.05 | -0.53% | -0.61% |
| 2018-04-17 | PEGA | SQZ | y | 62.26 | 63.45 | 83 | 61.8 | -0.74% | 1.51% |
| 2018-04-17 | ROL | SQZ | y | 52.65 | 53.97 | 84 | 52.16 | -0.93% | 0.82% |
| 2018-04-18 | SGY | SQZ | y | 38.11 | 39.53 | 93 | 37.67 | -1.15% | 0.76% |
| 2018-04-16 | CHRW | DB | y | 95.67 | 97.62 | 83 | 93.68 | -2.08% | 0.86% |
| 2018-04-17 | PGTI | SQZ | y | 18.61 | 18.65 | 89 | 17.65 | -5.16% | 0.48% |
| 2018-04-17 | DVAX | CWH | n | 19.95 | 20.1 | 93 | 18.075 | -9.4% | -1.75% |
| *RS Rank on day before breakout. | |||||||||
| Symbol | BO Price |
BO Vol. |
Company | Industry | RS Rank |
Last Close |
|---|---|---|---|---|---|---|
| DQ | 58.52 | 685,749 | DAQO New Energy Corp. American Depositary Shares - | Semiconductor Equipment & Materials | 97 | 54.51 |
| RFP | 10.15 | 434,976 | Resolute Forest Products Inc. Common Stock | Paper & Paper Products | 95 | 9.95 |
| WING | 50.98 | 871,918 | Wingstop Inc. - Common Stock | Restaurants | 94 | 50.76 |
| RYAM | 22.16 | 1,496,187 | Rayonier Advanced Materials Inc. Common Stock | Chemicals - Major Diversified | 94 | 22.07 |
| These stocks meet our suggested screening factors
for our Cup and Handle Chart Pattern watchlist. See Revised Rules for Trading Cup and Handle Breakouts |
||||||
| Index | Value | Change Week | Change YTD | Trend1 |
|---|---|---|---|---|
| Dow | 24462.9 |
0.42% | -1.04% | Down |
| NASDAQ | 7146.13 |
0.56% | 3.52% | Down |
| S&P 500 | 2670.14 |
0.52% | -0.13% | Down |
|
1The Market Trend is derived from
our proprietary market model. The market model is described on
the site here.
2The site also shows industry rankings based on fundamentals, combined technical and fundamentals, and on price alone. The site also shows daily industry movements. |
||||
| 1 Week | 13 Weeks | 26 Weeks | Year-to-Date |
|---|---|---|---|
| NASDAQ Composite |
NASDAQ Composite -2.59 % |
NASDAQ Composite 7.8 % |
NASDAQ Composite 3.52 % |
| 1 Week | 3 Weeks | 13 Weeks | 26 Weeks |
|---|---|---|---|
| Manufactured Housing |
Manufactured Housing |
Resorts & Casinos |
Resorts & Casinos |
| Silver 63 |
Toy & Hobby Stores 118 |
Manufactured Housing 199 |
Toy & Hobby Stores 190 |
| Charts of each industry rank and performance over 12 months are available on the site | |||
If you received this newsletter from a friend and you would like to receive it regularly please go to the BreakoutWatch.com site and you will then be able to register to receive the newsletter.
Copyright (c) 04/21/2018 NBIcharts, LLC dba BreakoutWatch.com. All
rights reserved.
" BreakoutWatch," the BreakoutWatch.com "eye" logo, and the slogan
"tomorrow's breakouts today" are service marks of NBIcharts LLC. All
other marks are the property of their respective owners, and are used
for descriptive purposes only.
BreakoutWatch is not affiliated with Investor's Business Daily or with Mr. William O'Neil. Our site, research and analysis is supported entirely by subscription and is free from advertising.