Breakoutwatch Weekly Summary 04/28/18
You are receiving this email because you are or were a BreakoutWatch.com subscriber, or have subscribed to our weekly newsletter. This newsletter summarizes the breakout events of the week and provides additional guidance that does not fit into our daily format. It is published each weekend.
| NASDAQ Still Threatens Bearish Head
and Shoulders Top The major indexes again closed slightly lower despite strong earnings reports from those corporations that reported this week. Rising Treasury yields brought sharp drops on Tuesday and Wednesday as higher interest rates threatened future profits. The turnaround on Thursday and Friday may have been in response to positive signs of lower tension on the Korean Peninsular. Our trend signals remain negative for all three major indexes and the NASDAQ Composite continues to show a possible Head and Shoulders Top pattern forming. The pattern will be confirmed if the index closes below the neckline, currently at about 6900. That's 3% below Friday's close. 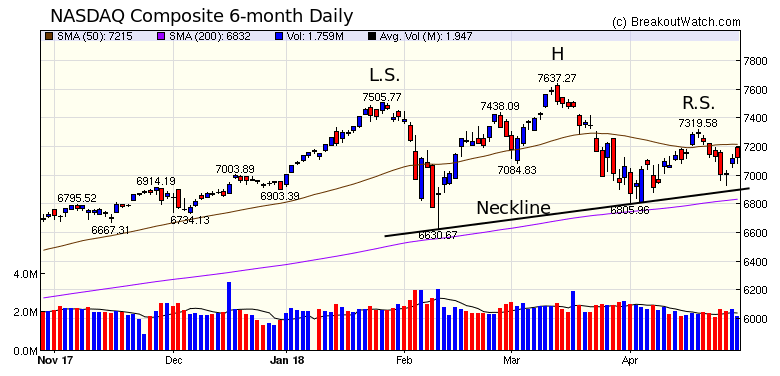 |
| No new features this week. |
|
Our latest strategy
suggestions are here.
A subscriber asked for a more detailed explanation of how the ATR bands are calculated for the ATR Band study on out Technical Charts tool. So here goes. The bands are calculated by first calculating a moving 14 day average of closing prices. Secondly the 'true range' is calculated for each day and finally the 14 day average of the true range. The average true range is then added to the 14 day average price to give the upper band and subtracted to give the lower band. This is illustrated in the chart of FSLR which broke out from a CWH base on Friday. The upper chart shows the upper and lower ATR bands with the 14 day moving average running through the middle of them. The latest 14 day average is 73.7 (14dma). The lower chart shows the calculation of the daily ATR and the 14 day average ATR. The latest value of the Average True Range is 2.805. We now obtain the upper ATR band as 73.7 + 2.805 -> 76.505 (ATR Up) and the lower ATR band as 73.7 - 2.805 -> 70.895 (ATR Dn) 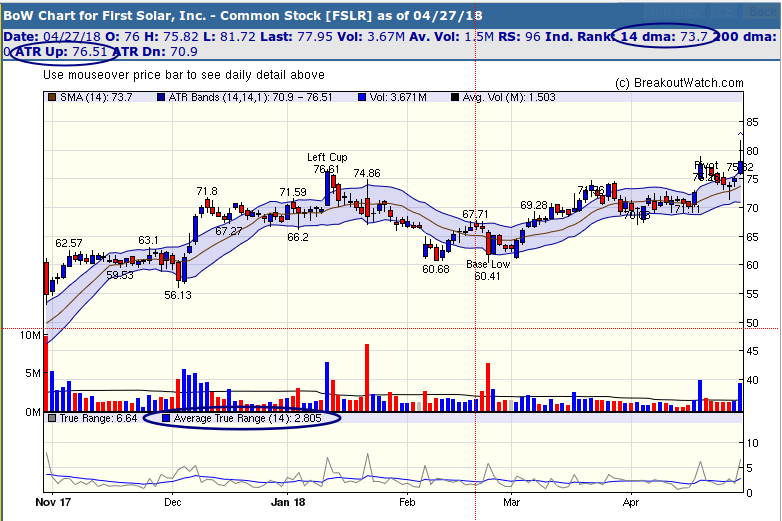 |
| List | Breakouts | Avg. Gain |
|---|---|---|
| CWH | 12 | 2.88 |
| SQZ | 7 | 2.98 |
| HTF | 0 | |
| HSB | 0 | |
| DB | 7 | 1.55 |
| Brkout Date | Symbol | Base | Squeeze | BrkoutOut Price | Brkout Day Close | RS Rank* | Last Close | Current % off BOP | Gain at Intraday High |
|---|---|---|---|---|---|---|---|---|---|
| 2018-04-26 | BJRI | CWH | n | 48.90 | 49.55 | 91 | 56.2 | 14.93% | 8.08% |
| 2018-04-27 | KLXI | CWH | n | 73.86 | 80.05 | 88 | 80.05 | 8.38% | -2.25% |
| 2018-04-23 | SNV | DB | y | 50.09 | 51.2 | 73 | 53.2 | 6.21% | 5.55% |
| 2018-04-25 | CNMD | SQZ | y | 61.77 | 63.11 | 84 | 65.25 | 5.63% | 5.1% |
| 2018-04-27 | SPSC | CWH | n | 65.32 | 68.74 | 85 | 68.74 | 5.24% | 2.79% |
| 2018-04-26 | DPZ | CWH | y | 238.44 | 250.61 | 84 | 248.42 | 4.19% | 3.65% |
| 2018-04-26 | AZPN | CWH | n | 86.26 | 91.05 | 89 | 89.79 | 4.09% | 3.32% |
| 2018-04-27 | FSLR | CWH | n | 75.26 | 77.95 | 95 | 77.95 | 3.57% | 0.74% |
| 2018-04-26 | CNMD | SQZ | y | 63.12 | 66.2 | 85 | 65.25 | 3.37% | 2.85% |
| 2018-04-27 | MMSI | SQZ | y | 46.36 | 47.9 | 83 | 47.9 | 3.32% | 0.19% |
| 2018-04-26 | OFIX | SQZ | y | 59.71 | 60.93 | 86 | 61.37 | 2.78% | 1.49% |
| 2018-04-24 | ZION | SQZ | y | 54.27 | 55.09 | 80 | 55.6 | 2.45% | 1.38% |
| 2018-04-23 | BBT | DB | n | 52.47 | 53.53 | 72 | 53.41 | 1.79% | 2.38% |
| 2018-04-25 | FITB | SQZ | y | 33.26 | 33.54 | 81 | 33.83 | 1.71% | 0.84% |
| 2018-04-27 | MNTA | CWH | n | 20.50 | 20.85 | 90 | 20.85 | 1.71% | -2.93% |
| 2018-04-25 | BLD | SQZ | y | 78.87 | 79.02 | 99 | 80.15 | 1.62% | 0.24% |
| 2018-04-25 | KBWB | DB | y | 55.46 | 55.65 | 79 | 55.9 | 0.79% | 0.11% |
| 2018-04-26 | KBWB | DB | n | 55.46 | 55.47 | 79 | 55.9 | 0.79% | 0.11% |
| 2018-04-24 | KBWB | DB | n | 55.46 | 55.68 | 79 | 55.9 | 0.79% | 0.11% |
| 2018-04-26 | CTS | CWH | n | 29.55 | 29.9 | 84 | 29.7 | 0.51% | -0.68% |
| 2018-04-23 | FLR | DB | n | 59.99 | 61.48 | 81 | 60.22 | 0.38% | -0.9% |
| 2018-04-26 | AWR | DB | n | 55.95 | 57.65 | 70 | 56.01 | 0.11% | -0.16% |
| 2018-04-24 | BUFF | CWH | n | 39.98 | 40 | 94 | 40 | 0.05% | -0.2% |
| 2018-04-23 | EHIC | CWH | n | 13.12 | 13.17 | 84 | 13.05 | -0.53% | -0.53% |
| 2018-04-24 | BBL | CWH | n | 42.80 | 42.84 | 80 | 42.15 | -1.52% | -0.51% |
| 2018-04-26 | MTRN | CWH | n | 54.45 | 55.35 | 87 | 51.15 | -6.06% | -3.58% |
| *RS Rank on day before breakout. | |||||||||
| Symbol | BO Price |
BO Vol. |
Company | Industry | RS Rank |
Last Close |
|---|---|---|---|---|---|---|
| USAK | 27.34 | 156,516 | USA Truck - Inc. - Common Stock | Trucking | 98 | 24.99 |
| VRS | 18.69 | 768,828 | Verso Corporation Common Stock | Paper & Paper Products | 98 | 18.33 |
| DAVE | 8.30 | 75,328 | Famous Dave's of America, Inc. | Restaurants | 97 | 8.10 |
| BLFS | 7.33 | 149,438 | BioLife Solutions - Inc. - Common Stock | Medical Appliances & Equipment | 97 | 7.22 |
| CSX | 60.34 | 8,233,104 | CSX Corporation - Common Stock | Railroads | 96 | 60.28 |
| PLNT | 40.56 | 1,667,564 | Planet Fitness - Inc. Common Stock | Sporting Activities | 95 | 40.50 |
| These stocks meet our suggested screening factors
for our Cup and Handle Chart Pattern watchlist. See Revised Rules for Trading Cup and Handle Breakouts |
||||||
| Index | Value | Change Week | Change YTD | Trend1 |
|---|---|---|---|---|
| Dow | 24311.2 |
-0.62% | -1.65% | Down |
| NASDAQ | 7119.8 |
-0.37% | 3.13% | Down |
| S&P 500 | 2669.91 |
-0.01% | -0.14% | Down |
|
1The Market Trend is derived from
our proprietary market model. The market model is described on
the site here.
2The site also shows industry rankings based on fundamentals, combined technical and fundamentals, and on price alone. The site also shows daily industry movements. |
||||
| 1 Week | 13 Weeks | 26 Weeks | Year-to-Date |
|---|---|---|---|
| S&P 500 |
NASDAQ Composite -5.14 % |
NASDAQ Composite 6.25 % |
NASDAQ Composite 3.13 % |
| 1 Week | 3 Weeks | 13 Weeks | 26 Weeks |
|---|---|---|---|
| Home Health Care |
Manufactured Housing |
Gaming Activities |
Resorts & Casinos |
| Air Services - Other 99 |
Air Services - Other 126 |
Manufactured Housing 205 |
Sporting Goods Stores 204 |
| Charts of each industry rank and performance over 12 months are available on the site | |||
If you received this newsletter from a friend and you would like to receive it regularly please go to the BreakoutWatch.com site and you will then be able to register to receive the newsletter.
Copyright (c) 04/28/2018 NBIcharts, LLC dba BreakoutWatch.com. All
rights reserved.
" BreakoutWatch," the BreakoutWatch.com "eye" logo, and the slogan
"tomorrow's breakouts today" are service marks of NBIcharts LLC. All
other marks are the property of their respective owners, and are used
for descriptive purposes only.
BreakoutWatch is not affiliated with Investor's Business Daily or with Mr. William O'Neil. Our site, research and analysis is supported entirely by subscription and is free from advertising.