Breakoutwatch Weekly Summary 05/05/18
You are receiving this email because you are or were a BreakoutWatch.com subscriber, or have subscribed to our weekly newsletter. This newsletter summarizes the breakout events of the week and provides additional guidance that does not fit into our daily format. It is published each weekend.
| Trend Indicators Remain Down as
NASDAQ Meets Resistance at 50 day Average The major indexes had mixed successes this week with the NASDAQ gaining 1.3% while the S&P 500 and DJI each slipped 0.2%. The S&P 500 would have lost more were it not for the strength of Apple, which is the largest component of the S&P 500 by market cap, which gained 13.6% for the week. The NASDAQ Composite still threatens a bearish Head and Shoulders Top and two distribution days on Wednesday and Thursday increased the prospects of the pattern being completed, which would occur of the index closes below the neckline. The major indexes all opened in negative territory on Friday but a strong employment report caused a reversal. The NASDAQ briefly tested resistance at the 50 day average but closed lower for a 1.7% gain on the day. Volume was just insufficient to create an accumulation day to partially offset the two previous distribution days. Our trend indicators remain down for the three major indexes. 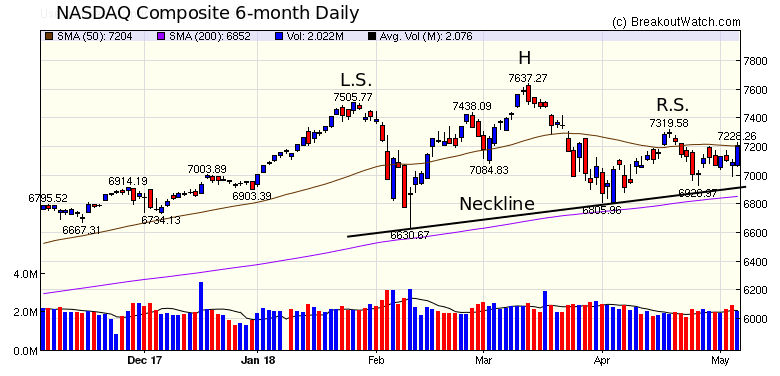 |
| No new features this week |
|
Our latest strategy
suggestions are here.
|
| List | Breakouts | Avg. Gain |
|---|---|---|
| CWH | 8 | 2.57 |
| SQZ | 4 | 1.73 |
| HTF | 0 | |
| HSB | 0 | |
| DB | 4 | 3.18 |
| Brkout Date | Symbol | Base | Squeeze | BrkoutOut Price | Brkout Day Close | RS Rank* | Last Close | Current % off BOP | Gain at Intraday High |
|---|---|---|---|---|---|---|---|---|---|
| 2018-05-01 | APPF | CWH | n | 48.50 | 49.25 | 89 | 54.05 | 11.44% | 8.14% |
| 2018-05-03 | CECO | SQZ | y | 13.28 | 14.51 | 92 | 14.3 | 7.68% | 4.14% |
| 2018-05-02 | MA | DB | n | 178.26 | 185.82 | 87 | 188.17 | 5.56% | 3.84% |
| 2018-05-03 | CRY | CWH | n | 23.33 | 24.1 | 86 | 24.45 | 4.8% | 1.8% |
| 2018-05-02 | CNC | CWH | n | 111.53 | 114.24 | 84 | 116.65 | 4.59% | 2.92% |
| 2018-05-02 | GIB | DB | n | 58.28 | 59.16 | 70 | 59.87 | 2.73% | 1.75% |
| 2018-05-03 | GIB | DB | n | 58.28 | 59.65 | 74 | 59.87 | 2.73% | 1.75% |
| 2018-05-03 | WWE | CWH | n | 40.10 | 41.39 | 94 | 41.01 | 2.27% | 0.72% |
| 2018-05-03 | ULTI | DB | n | 248.04 | 249.11 | 82 | 252.25 | 1.7% | -0.15% |
| 2018-05-02 | RDWR | CWH | n | 22.32 | 23.01 | 84 | 22.64 | 1.43% | 2.02% |
| 2018-05-02 | CLMT | SQZ | y | 7.46 | 7.5 | 87 | 7.55 | 1.21% | -0.8% |
| 2018-05-03 | VVC | CWH | n | 70.24 | 70.52 | 80 | 70.3 | 0.09% | 0.09% |
| 2018-05-02 | AAC | SQZ | y | 11.52 | 12.15 | 93 | 11.51 | -0.09% | 0% |
| 2018-05-03 | INXN | CWH | n | 65.20 | 65.32 | 85 | 64.46 | -1.13% | -3.08% |
| 2018-04-30 | BANC | SQZ | y | 19.11 | 19.2 | 88 | 18.75 | -1.88% | 0.21% |
| 2018-05-02 | HSC | CWH | n | 22.10 | 22.4 | 85 | 21.45 | -2.94% | -1.58% |
| *RS Rank on day before breakout. | |||||||||
| Symbol | BO Price |
BO Vol. |
Company | Industry | RS Rank |
Last Close |
|---|---|---|---|---|---|---|
| IO | 29.25 | 355,953 | Ion Geophysical Corporation Common Stock | Oil & Gas Equipment & Services | 99 | 27.35 |
| VRS | 18.69 | 753,908 | Verso Corporation Common Stock | Paper & Paper Products | 98 | 18.61 |
| USAK | 27.34 | 148,926 | USA Truck - Inc. - Common Stock | Trucking | 98 | 24.63 |
| DAVE | 8.30 | 80,322 | Famous Dave's of America, Inc. | Restaurants | 96 | 7.95 |
| CSX | 60.34 | 7,924,668 | CSX Corporation - Common Stock | Railroads | 96 | 59.97 |
| DIN | 79.23 | 702,999 | Dine Brands Global - Inc. Common Stock | Restaurants | 95 | 77.54 |
| BOOT | 19.73 | 484,734 | Boot Barn Holdings - Inc. Common Stock | Apparel Stores | 95 | 19.41 |
| PLNT | 40.56 | 1,604,372 | Planet Fitness - Inc. Common Stock | Sporting Activities | 94 | 40.45 |
| RFP | 10.15 | 400,030 | Resolute Forest Products Inc. Common Stock | Paper & Paper Products | 94 | 9.90 |
| These stocks meet our suggested screening factors
for our Cup and Handle Chart Pattern watchlist. See Revised Rules for Trading Cup and Handle Breakouts |
||||||
| Index | Value | Change Week | Change YTD | Trend1 |
|---|---|---|---|---|
| Dow | 24262.5 |
-0.2% | -1.85% | Down |
| NASDAQ | 7209.62 |
1.26% | 4.44% | Down |
| S&P 500 | 2663.42 |
-0.24% | -0.38% | Down |
|
1The Market Trend is derived from
our proprietary market model. The market model is described on
the site here.
2The site also shows industry rankings based on fundamentals, combined technical and fundamentals, and on price alone. The site also shows daily industry movements. |
||||
| 1 Week | 13 Weeks | 26 Weeks | Year-to-Date |
|---|---|---|---|
| NASDAQ Composite |
NASDAQ Composite -0.43 % |
NASDAQ Composite 6.58 % |
NASDAQ Composite 4.44 % |
| 1 Week | 3 Weeks | 13 Weeks | 26 Weeks |
|---|---|---|---|
| Manufactured Housing |
Manufactured Housing |
Publishing - Books |
Resorts & Casinos |
| Long Distance Carriers 173 |
Long Distance Carriers 181 |
Manufactured Housing 213 |
Sporting Goods Stores 201 |
| Charts of each industry rank and performance over 12 months are available on the site | |||
If you received this newsletter from a friend and you would like to receive it regularly please go to the BreakoutWatch.com site and you will then be able to register to receive the newsletter.
Copyright (c) 05/05/2018 NBIcharts, LLC dba BreakoutWatch.com. All
rights reserved.
" BreakoutWatch," the BreakoutWatch.com "eye" logo, and the slogan
"tomorrow's breakouts today" are service marks of NBIcharts LLC. All
other marks are the property of their respective owners, and are used
for descriptive purposes only.
BreakoutWatch is not affiliated with Investor's Business Daily or with Mr. William O'Neil. Our site, research and analysis is supported entirely by subscription and is free from advertising.