Breakoutwatch Weekly Summary 05/13/18
You are receiving this email because you are or were a BreakoutWatch.com subscriber, or have subscribed to our weekly newsletter. This newsletter summarizes the breakout events of the week and provides additional guidance that does not fit into our daily format. It is published each weekend.
| NASDAQ Breaks Out and Market Trends
Turn Positive Our market trend indicators for the three major indexes all turned positive on Wednesday on the same day as the NASDAQ broke out from a double bottom pattern. This was a positive week for the index following a strong start on Monday with a gap up that broke through the 50 day resistance line. Prices and daily volumes increased as the week progressed showing that buyers were returning to the market. The increasing momentum delivered accumulation days on Wednesday and Thursday. There was some profit taking on Friday but this was on low volume and left the index with a healthy 2.7% gain for the week. 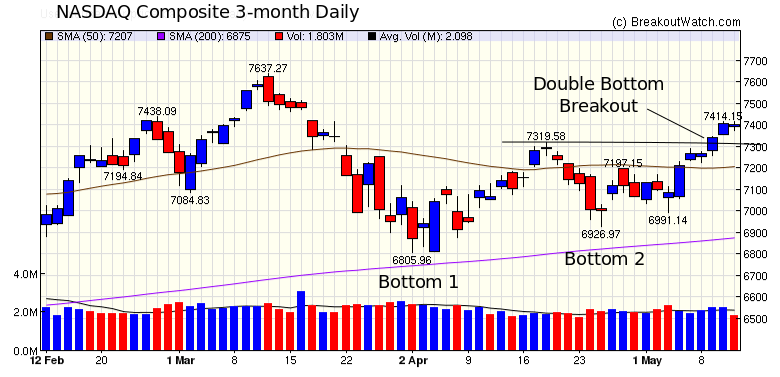 I regret that we experienced some
data issues on Monday and again on Friday. Watchlists for
Monday's session were impacted on Friday but that issue has
now been resolved and watchlists for Monday are available. I
am working this weekend to restore the live data feed so that
alerts can resume on Monday.
|
| No new features this week |
|
Our latest strategy
suggestions are here.
|
| List | Breakouts | Avg. Gain |
|---|---|---|
| CWH | 12 | 5.53 |
| SQZ | 3 | 1.23 |
| HTF | 0 | |
| HSB | 0 | |
| DB | 5 | 0.84 |
| Brkout Date | Symbol | Base | Squeeze | BrkoutOut Price | Brkout Day Close | RS Rank* | Last Close | Current % off BOP | Gain at Intraday High |
|---|---|---|---|---|---|---|---|---|---|
| 2018-05-09 | SUPN | CWH | n | 47.55 | 47.95 | 81 | 57.05 | 19.98% | 6.62% |
| 2018-05-08 | CAMT | CWH | n | 7.40 | 7.88 | 91 | 8.35 | 12.84% | 12.43% |
| 2018-05-08 | GTS | CWH | n | 28.66 | 30.56 | 90 | 32.09 | 11.97% | 11.86% |
| 2018-05-08 | ZBRA | DB | n | 142.90 | 153.24 | 87 | 155.57 | 8.87% | 7% |
| 2018-05-08 | AMED | CWH | n | 66.58 | 71.01 | 82 | 71.81 | 7.86% | 6.08% |
| 2018-05-07 | ULTI | DB | n | 248.04 | 258.07 | 83 | 263.16 | 6.1% | 4.54% |
| 2018-05-09 | BLD | DB | y | 79.45 | 81.01 | 99 | 82.52 | 3.86% | 3.46% |
| 2018-05-09 | AKAM | SQZ | y | 73.69 | 77.3 | 89 | 76.3 | 3.54% | 3.24% |
| 2018-05-09 | NBL | CWH | n | 33.75 | 34.9 | 83 | 34.86 | 3.29% | 3.11% |
| 2018-05-09 | LQ | CWH | n | 19.64 | 20.25 | 80 | 20.26 | 3.16% | 3% |
| 2018-05-09 | NICE | CWH | n | 97.08 | 98.12 | 80 | 100.13 | 3.14% | 1.61% |
| 2018-05-08 | VCEL | CWH | n | 13.00 | 13.25 | 98 | 13.3 | 2.31% | -0.77% |
| 2018-05-08 | NGHC | CWH | n | 25.96 | 26.43 | 86 | 26.18 | 0.85% | -0.23% |
| 2018-05-09 | TDY | CWH | n | 197.43 | 197.91 | 82 | 198.27 | 0.43% | -0.16% |
| 2018-05-09 | DO | CWH | n | 19.09 | 19.9 | 87 | 19.17 | 0.42% | 2.78% |
| 2018-05-09 | BGC | SQZ | y | 29.71 | 29.75 | 90 | 29.8 | 0.3% | 0.3% |
| 2018-05-09 | E | CWH | n | 39.34 | 39.66 | 80 | 39.37 | 0.08% | 0.23% |
| 2018-05-08 | AMSWA | SQZ | y | 13.28 | 13.3 | 81 | 13.26 | -0.15% | -0.23% |
| 2018-05-08 | JOUT | DB | n | 74.74 | 75.94 | 85 | 73.08 | -2.22% | 0.62% |
| 2018-05-08 | WB | DB | n | 122.50 | 127.99 | 91 | 107.32 | -12.39% | 0.41% |
| *RS Rank on day before breakout. | |||||||||
| Symbol | BO Price |
BO Vol. |
Company | Industry | RS Rank |
Last Close |
|---|---|---|---|---|---|---|
| IO | 29.25 | 347,670 | Ion Geophysical Corporation Common Stock | Oil & Gas Equipment & Services | 99 | 27.15 |
| CVRR | 18.89 | 814,311 | CVR Refining - LP Common Units Representing Limited | Oil & Gas Refining & Marketing | 96 | 18.70 |
| DAVE | 8.30 | 80,805 | Famous Dave's of America, Inc. | Restaurants | 96 | 7.95 |
| RFP | 10.15 | 412,844 | Resolute Forest Products Inc. Common Stock | Paper & Paper Products | 94 | 9.90 |
| DIN | 79.23 | 649,178 | Dine Brands Global - Inc. Common Stock | Restaurants | 94 | 74.98 |
| These stocks meet our suggested screening factors
for our Cup and Handle Chart Pattern watchlist. See Revised Rules for Trading Cup and Handle Breakouts |
||||||
| Index | Value | Change Week | Change YTD | Trend1 |
|---|---|---|---|---|
| Dow | 24831.2 |
2.34% | 0.45% | Up |
| NASDAQ | 7402.88 |
2.68% | 7.24% | Up |
| S&P 500 | 2727.72 |
2.41% | 2.02% | Up |
|
1The Market Trend is derived from
our proprietary market model. The market model is described on
the site here.
2The site also shows industry rankings based on fundamentals, combined technical and fundamentals, and on price alone. The site also shows daily industry movements. |
||||
| 1 Week | 13 Weeks | 26 Weeks | Year-to-Date |
|---|---|---|---|
| NASDAQ Composite |
NASDAQ Composite 7.69 % |
NASDAQ Composite 9.66 % |
NASDAQ Composite 7.24 % |
| 1 Week | 3 Weeks | 13 Weeks | 26 Weeks |
|---|---|---|---|
| Manufactured Housing |
Manufactured Housing |
Publishing - Books |
Resorts & Casinos |
| Recreational Goods - Other 55 |
Long Distance Carriers 160 |
Manufactured Housing 213 |
Sporting Goods Stores 198 |
| Charts of each industry rank and performance over 12 months are available on the site | |||
If you received this newsletter from a friend and you would like to receive it regularly please go to the BreakoutWatch.com site and you will then be able to register to receive the newsletter.
Copyright (c) 05/13/2018 NBIcharts, LLC dba BreakoutWatch.com. All
rights reserved.
" BreakoutWatch," the BreakoutWatch.com "eye" logo, and the slogan
"tomorrow's breakouts today" are service marks of NBIcharts LLC. All
other marks are the property of their respective owners, and are used
for descriptive purposes only.
BreakoutWatch is not affiliated with Investor's Business Daily or with Mr. William O'Neil. Our site, research and analysis is supported entirely by subscription and is free from advertising.