Breakoutwatch Weekly Summary 07/14/18
You are receiving this email because you are or were a BreakoutWatch.com subscriber, or have subscribed to our weekly newsletter. This newsletter summarizes the breakout events of the week and provides additional guidance that does not fit into our daily format. It is published each weekend.
|
NASDAQ Consolidation Likely
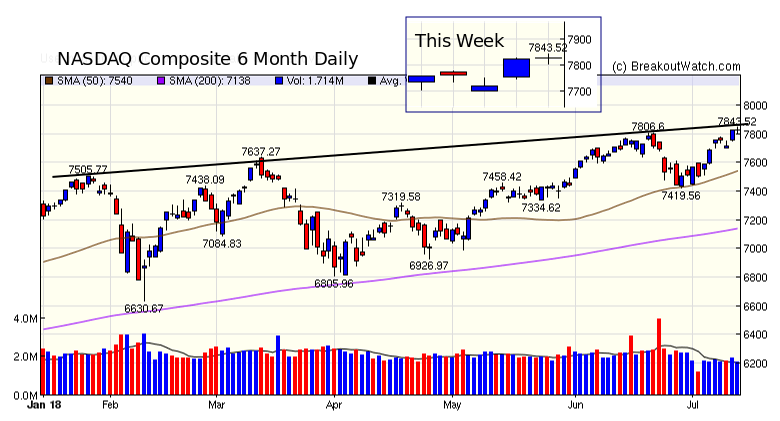
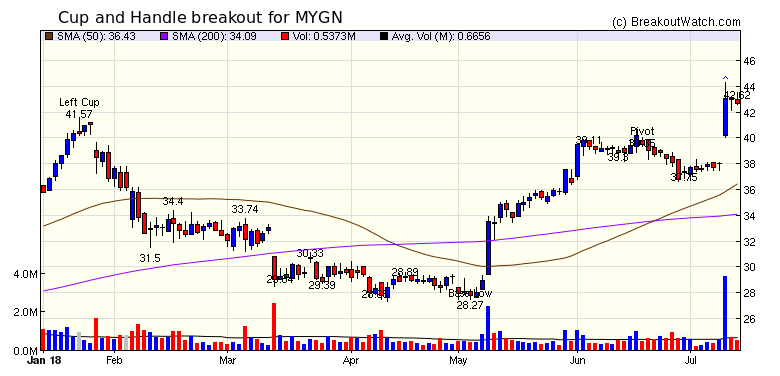
I'm back from my European trip and would like to welcome new subscribers that joined while I was away. For their benefit, I note that we focus on the NASDAQ exchange in our newsletter, as that is where most breakouts from our patterns occur. The NASDAQ set another new high on Friday at 7843 but as the inset on the chart below shows the index pulled back into a doji candlestick. A doji shows balance between buyers and sellers. It implies indecision and that a change in trend may be near. The 6-month chart shows that Friday's high touched the longer term trend line of new highs. Note that these new highs have been followed by pull-backs, so I would not be surprised to see a consolidation in the near future. For the year, the NASDAQ has gained over 13% leaving the S&P 500 (4.8%) and the DJI (1.2%) well behind.  Volumes were typically below the 50
day average limiting the number of cup and handle breakouts. The
top performer, MYGN gapped up from low in the handle but could
have been bought at just above the pivot price. An indication
that a breakout was possible was the sudden increase in volume
the day before breakout.
 |
| No new features this week |
|
Our latest strategy
suggestions are here.
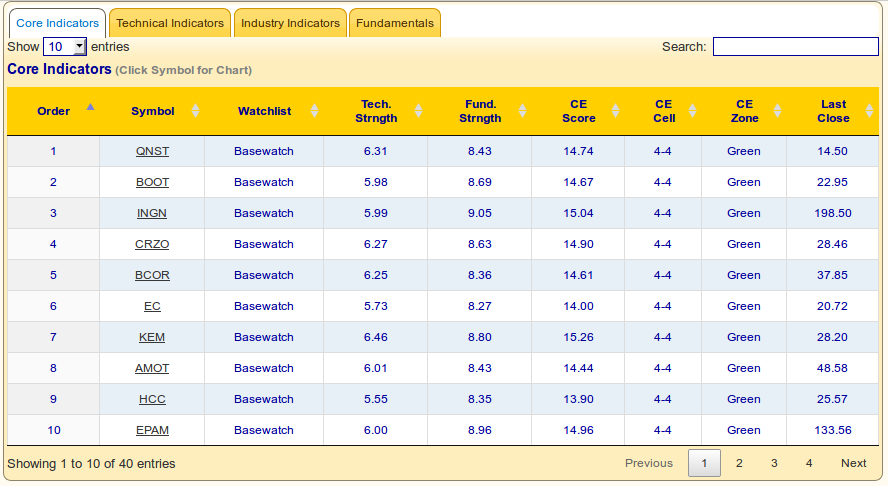
How to Search our Database A feature of our site that is often overlooked is the 'Database Search' option on the Mine for Candidates menu. Although this feature dates back to the early days of the site, it remains a powerful method of searching for potential future breakouts. To summarize, the database search allows you to select stocks by several criteria:
 This yields the following
results. The Tabs can be clicked to show Core,
Technical,Industry or Fundamental Indicators.
 |
| List | Breakouts | Avg. Gain |
|---|---|---|
| CWH | 3 | 5.09 |
| SQZ | 6 | 2.07 |
| HTF | 0 | |
| HSB | 0 | |
| DB | 0 |
| Brkout Date | Symbol | Base | Squeeze | BrkoutOut Price | Brkout Day Close | RS Rank* | Last Close | Current % off BOP | Gain at Intraday High |
|---|---|---|---|---|---|---|---|---|---|
| 2018-07-11 | MYGN | CWH | n | 39.35 | 43.04 | 85 | 42.69 | 8.49% | 8.31% |
| 2018-07-09 | GLOB | CWH | n | 56.22 | 56.76 | 83 | 58.95 | 4.86% | 2.54% |
| 2018-07-09 | EPAM | SQZ | y | 128.27 | 130.48 | 86 | 133.56 | 4.12% | 3.32% |
| 2018-07-12 | ATVI | SQZ | y | 78.62 | 81.37 | 84 | 81.5 | 3.66% | 1.65% |
| 2018-07-12 | TSS | SQZ | y | 88.20 | 91.18 | 80 | 90.28 | 2.36% | 2.06% |
| 2018-07-09 | PNK | SQZ | y | 34.36 | 34.39 | 86 | 35.04 | 1.98% | 1.66% |
| 2018-07-12 | EGHT | CWH | n | 20.75 | 21.65 | 88 | 21.15 | 1.93% | 0.72% |
| 2018-07-12 | NXST | SQZ | y | 81.01 | 84 | 84 | 82.5 | 1.84% | 1.28% |
| 2018-07-12 | SRNE | SQZ | y | 7.21 | 7.5 | 97 | 7.1 | -1.53% | -1.53% |
| *RS Rank on day before breakout. | |||||||||
| Symbol | BO Price |
BO Vol. |
Company | Industry | RS Rank |
Last Close |
|---|---|---|---|---|---|---|
| WTI | 8.10 | 6,365,532 | W&T Offshore - Inc. Common Stock | Oil & Gas Drilling & Exploration | 98 | 8.08 |
| AMEH | 27.20 | 113,594 | Apollo Medical Holdings - Inc. - Common Stock | Specialized Health Services | 97 | 23.30 |
| MIXT | 18.78 | 208,444 | MiX Telematics Limited American Depositary Shares, | Technical & System Software | 95 | 18.53 |
| ANF | 27.27 | 4,138,924 | Abercrombie & Fitch Company Common Stock | Apparel Stores | 95 | 25.16 |
| These stocks meet our suggested screening factors
for our Cup and Handle Chart Pattern watchlist. See Revised Rules for Trading Cup and Handle Breakouts |
||||||
| Index | Value | Change Week | Change YTD | Trend1 |
|---|---|---|---|---|
| Dow | 25019.4 |
2.3% | 1.21% | Up |
| NASDAQ | 7825.98 |
1.79% | 13.36% | Up |
| S&P 500 | 2801.31 |
1.5% | 4.78% | Up |
|
1The Market Trend is derived from
our proprietary market model. The market model is described on
the site here.
2The site also shows industry rankings based on fundamentals, combined technical and fundamentals, and on price alone. The site also shows daily industry movements. |
||||
| 1 Week | 13 Weeks | 26 Weeks | Year-to-Date |
|---|---|---|---|
| Dow Jones |
NASDAQ Composite 10.12 % |
NASDAQ Composite 7.78 % |
NASDAQ Composite 13.36 % |
| 1 Week | 3 Weeks | 13 Weeks | 26 Weeks |
|---|---|---|---|
| Manufactured Housing |
Manufactured Housing |
Manufactured Housing |
Home Health Care |
| General Contractors 40 |
REIT - Healthcare Facilities 81 |
Long Distance Carriers 175 |
Manufactured Housing 213 |
| Charts of each industry rank and performance over 12 months are available on the site | |||
If you received this newsletter from a friend and you would like to receive it regularly please go to the BreakoutWatch.com site and you will then be able to register to receive the newsletter.
Copyright (c) 07/14/2018 NBIcharts, LLC dba BreakoutWatch.com. All
rights reserved.
" BreakoutWatch," the BreakoutWatch.com "eye" logo, and the slogan
"tomorrow's breakouts today" are service marks of NBIcharts LLC. All
other marks are the property of their respective owners, and are used
for descriptive purposes only.
BreakoutWatch is not affiliated with Investor's Business Daily or with Mr. William O'Neil. Our site, research and analysis is supported entirely by subscription and is free from advertising.