Breakoutwatch Weekly Summary 08/04/18
You are receiving this email because you are or were a BreakoutWatch.com subscriber, or have subscribed to our weekly newsletter. This newsletter summarizes the breakout events of the week and provides additional guidance that does not fit into our daily format. It is published each weekend.
| Over 20 Breakouts as NASDAQ
Recovers The NASDAQ found support at the 50 day average level on Monday and continued to climb buoyed by Apple's strong earnings report and positive forward guidance, unchanged interest rates as the Fed reported the economy is strong, and an employment report that revised upwards last quarter's employment growth, lowered the unemployment rate to 3.9% and showed wages are rising at below the inflation rate. For the week, the NASDAQ gained 1% and could soon test resistance at 7933. Four days of upward momentum produced 21 breakouts with the cup and handle pattern delivering 10 while the Double Bottom pattern continued last weeks good performance with 7 breakouts averaging an 8.8% gain. 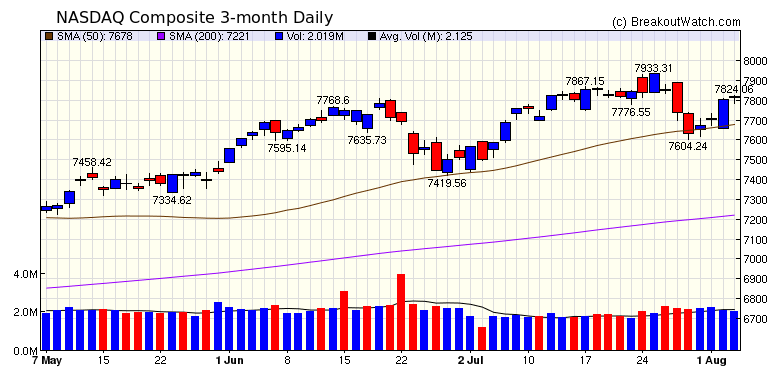 |
| No new features this week |
|
Our latest strategy
suggestions are here.
|
| List | Breakouts | Avg. Gain |
|---|---|---|
| CWH | 10 | 3.37 |
| SQZ | 4 | 0.01 |
| HTF | 0 | |
| HSB | 0 | |
| DB | 7 | 8.77 |
| Brkout Date | Symbol | Base | Squeeze | BrkoutOut Price | Brkout Day Close | RS Rank* | Last Close | Current % off BOP | Gain at Intraday High |
|---|---|---|---|---|---|---|---|---|---|
| 2018-08-01 | PAYC | DB | n | 112.48 | 125.94 | 79 | 132.82 | 18.08% | 16.23% |
| 2018-08-02 | DNOW | SQZ | y | 14.72 | 16.83 | 80 | 17.31 | 17.6% | 17.12% |
| 2018-08-01 | NANO | DB | y | 37.30 | 39.9 | 92 | 42.27 | 13.32% | 8.93% |
| 2018-07-31 | LMNR | DB | y | 25.71 | 27.26 | 76 | 28.51 | 10.89% | 8.4% |
| 2018-07-30 | OPY | DB | y | 28.85 | 29.55 | 89 | 31.65 | 9.71% | 8.49% |
| 2018-08-03 | WAIR | CWH | n | 12.05 | 13.2 | 88 | 13.2 | 9.54% | 0% |
| 2018-08-02 | RFP | CWH | n | 11.35 | 12.45 | 93 | 12.3 | 8.37% | 5.29% |
| 2018-08-01 | EHTH | CWH | n | 24.14 | 25.94 | 85 | 25.76 | 6.71% | 5.43% |
| 2018-08-02 | ZTS | DB | n | 86.62 | 91.43 | 79 | 91.63 | 5.78% | 3.05% |
| 2018-08-03 | ZTS | DB | n | 86.62 | 91.63 | 86 | 91.63 | 5.78% | 3.05% |
| 2018-07-31 | GNRC | CWH | n | 53.44 | 53.75 | 81 | 55.76 | 4.34% | 3.59% |
| 2018-08-01 | MANT | CWH | n | 59.89 | 60.41 | 82 | 61.95 | 3.44% | 2.69% |
| 2018-08-03 | CAMT | CWH | n | 8.36 | 8.62 | 91 | 8.62 | 3.11% | -0% |
| 2018-07-31 | SNE | CWH | n | 53.49 | 54.02 | 83 | 54.96 | 2.75% | 2.34% |
| 2018-07-31 | EYE | CWH | n | 40.25 | 40.66 | 85 | 41.03 | 1.94% | 0.3% |
| 2018-08-02 | GMED | SQZ | y | 52.86 | 53.89 | 89 | 52.69 | -0.32% | -0.19% |
| 2018-08-02 | TBK | DB | n | 42.15 | 42.3 | 82 | 41.25 | -2.14% | -2.14% |
| 2018-08-01 | EGL | CWH | n | 34.83 | 36.06 | 86 | 33.84 | -2.84% | -0.98% |
| 2018-08-02 | ITCI | CWH | n | 21.69 | 21.84 | 90 | 20.9 | -3.64% | -4.79% |
| 2018-07-31 | CVI | SQZ | y | 39.04 | 39.29 | 91 | 35.95 | -7.91% | -0.36% |
| 2018-08-02 | CPS | SQZ | y | 142.10 | 144.83 | 83 | 128.86 | -9.32% | -1.51% |
| *RS Rank on day before breakout. | |||||||||
| Symbol | BO Price |
BO Vol. |
Company | Industry | RS Rank |
Last Close |
|---|---|---|---|---|---|---|
| WTI | 8.57 | 6,137,964 | W&T Offshore - Inc. Common Stock | Oil & Gas Drilling & Exploration | 98 | 7.20 |
| AMEH | 27.20 | 130,178 | Apollo Medical Holdings - Inc. - Common Stock | Specialized Health Services | 97 | 23.87 |
| ESND | 16.11 | 356,013 | Essendant Inc. - Common Stock | Business Equipment | 96 | 15.91 |
| HAE | 98.75 | 1,237,959 | Haemonetics Corporation Common Stock | Medical Instruments & Supplies | 96 | 96.71 |
| BOOT | 24.75 | 968,224 | Boot Barn Holdings - Inc. Common Stock | Apparel Stores | 96 | 23.08 |
| These stocks meet our suggested screening factors
for our Cup and Handle Chart Pattern watchlist. See Revised Rules for Trading Cup and Handle Breakouts |
||||||
| Index | Value | Change Week | Change YTD | Trend1 |
|---|---|---|---|---|
| Dow | 25462.6 |
0.05% | 3.01% | Up |
| NASDAQ | 7812.02 |
0.96% | 13.16% | Up |
| S&P 500 | 2840.35 |
0.76% | 6.24% | Up |
|
1The Market Trend is derived from
our proprietary market model. The market model is described on
the site here.
2The site also shows industry rankings based on fundamentals, combined technical and fundamentals, and on price alone. The site also shows daily industry movements. |
||||
| 1 Week | 13 Weeks | 26 Weeks | Year-to-Date |
|---|---|---|---|
| NASDAQ Composite |
NASDAQ Composite 8.36 % |
NASDAQ Composite 7.89 % |
NASDAQ Composite 13.16 % |
| 1 Week | 3 Weeks | 13 Weeks | 26 Weeks |
|---|---|---|---|
| Auto Parts Stores |
Auto Parts Stores |
Manufactured Housing |
Home Health Care |
| Synthetics 209 |
Synthetics 210 |
Dairy Products 215 |
Dairy Products 213 |
| Charts of each industry rank and performance over 12 months are available on the site | |||
If you received this newsletter from a friend and you would like to receive it regularly please go to the BreakoutWatch.com site and you will then be able to register to receive the newsletter.
Copyright (c) 08/04/2018 NBIcharts, LLC dba BreakoutWatch.com. All
rights reserved.
" BreakoutWatch," the BreakoutWatch.com "eye" logo, and the slogan
"tomorrow's breakouts today" are service marks of NBIcharts LLC. All
other marks are the property of their respective owners, and are used
for descriptive purposes only.
BreakoutWatch is not affiliated with Investor's Business Daily or with Mr. William O'Neil. Our site, research and analysis is supported entirely by subscription and is free from advertising.