Breakoutwatch Weekly Summary 10/06/18
You are receiving this email because you are or were a BreakoutWatch.com subscriber, or have subscribed to our weekly newsletter. This newsletter summarizes the breakout events of the week and provides additional guidance that does not fit into our daily format. It is published each weekend.
| NASDAQ Loses 3.2% Week-on-Week The NASDAQ (and S&P 500 ) crashed through the 50 day support level on Thursday and continued to fall on Friday as 'The 10-year Treasury note yield hit its highest since 2011, while the 30-year bond yield trades at its highest since 2014' - Marketwatch. Higher Yields altered the risk trade-off between stocks and bonds resulting in a movement out of stocks (which are at an historically abnormal high Shiller PE ratio of 32.71). The NASDAQ closed at 7788 on Friday and is 4.2% below it's recent high so well short of an official correction (10%) and our market trend indicators remain positive. The next support level is at 7604 (-6.5%) and then the 200 dma at 7483 (-8%); Consequently, this was a disappointing week for breakouts with only 2 of 8 finishing with a positive gain. On a brighter note, I've added two new filters to our watchlists this week. See new features below. 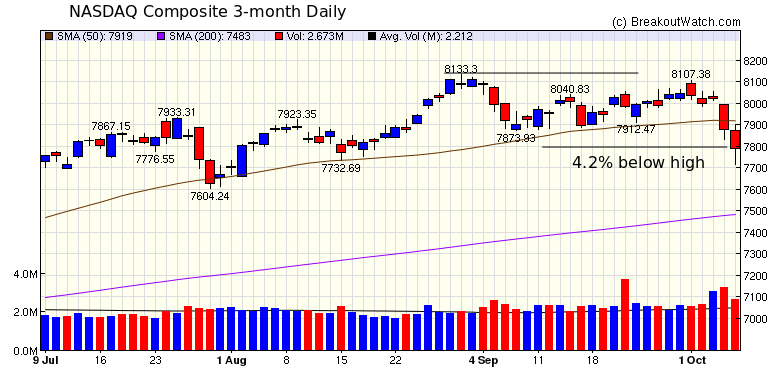 |
Two New Watchlist Filters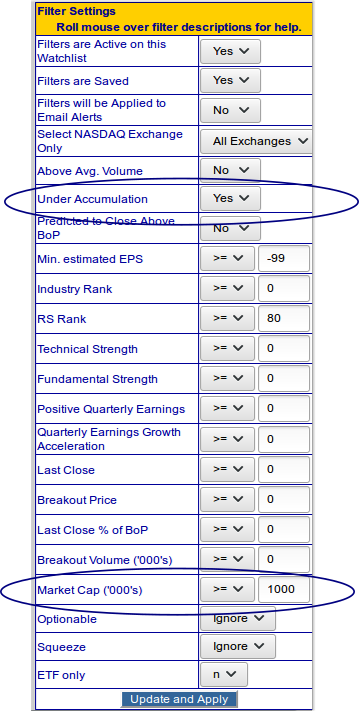 I have often remarked that the potential for a
breakout can be foreseen by a rise in price and volume on the
day before breakout. Technically, this is called 'accumulation'
and I've added a filter allowing the selection of stocks that
were under accumulation on the day the watchlist was published. I have often remarked that the potential for a
breakout can be foreseen by a rise in price and volume on the
day before breakout. Technically, this is called 'accumulation'
and I've added a filter allowing the selection of stocks that
were under accumulation on the day the watchlist was published.I also had a request from a subscriber to allow a filter on Market Cap. The filter will select watchlist stocks that are either above (or below) a specified total valuation on the day the watchlist is published. The value should be entered in 000's. So a market cap of 1 billion would be specified as 1000000. |
|
Our latest strategy
suggestions are here.
|
| List | Breakouts | Avg. Gain |
|---|---|---|
| CWH | 3 | -0.13 |
| SQZ | 4 | -1.41 |
| HTF | 0 | |
| HSB | 0 | |
| DB | 1 | -0.8 |
| Brkout Date | Symbol | Base | Squeeze | BrkoutOut Price | Brkout Day Close | RS Rank* | Last Close | Current % off BOP | Gain at Intraday High |
|---|---|---|---|---|---|---|---|---|---|
| 2018-10-05 | EHTH | SQZ | y | 29.45 | 30.31 | 94 | 30.31 | 2.92% | -1.77% |
| 2018-10-05 | RDNT | CWH | n | 15.31 | 15.47 | 82 | 15.47 | 1.05% | -5.29% |
| 2018-10-03 | XOXO | CWH | n | 34.63 | 34.68 | 94 | 34.51 | -0.35% | -0.58% |
| 2018-10-04 | DE | DB | n | 157.66 | 158.31 | 74 | 156.4 | -0.8% | -1.25% |
| 2018-10-01 | EPM | CWH | n | 11.12 | 11.24 | 91 | 11 | -1.08% | 0.36% |
| 2018-10-03 | CCOI | SQZ | y | 55.77 | 56.03 | 80 | 55.03 | -1.33% | -0.47% |
| 2018-10-04 | MSG | SQZ | y | 308.76 | 309.47 | 86 | 300.62 | -2.64% | -2.97% |
| 2018-10-02 | GLMD | SQZ | y | 13.73 | 14.47 | 95 | 13.1 | -4.59% | 3.06% |
| *RS Rank on day before breakout. | |||||||||
| Symbol | BO Price |
BO Vol. |
Company | Industry | RS Rank |
Last Close |
|---|---|---|---|---|---|---|
| ABMD | 442.94 | 848,600 | ABIOMED - Inc. - Common Stock | Medical Appliances & Equipment | 96 | 415.71 |
| GPRK | 20.45 | 370,029 | Geopark Ltd Common Shares | Oil & Gas Drilling & Exploration | 96 | 19.59 |
| WLL | 53.13 | 3,573,580 | Whiting Petroleum Corporation Common Stock | Oil & Gas Drilling & Exploration | 94 | 48.26 |
| ADUS | 71.45 | 237,018 | Addus HomeCare Corporation - Common Stock | Home Health Care | 94 | 65.05 |
| XOXO | 34.63 | 468,950 | XO Group - Inc. Common Stock | Specialty Retail - Other | 94 | 34.51 |
| These stocks meet our suggested screening factors
for our Cup and Handle Chart Pattern watchlist. See Revised Rules for Trading Cup and Handle Breakouts |
||||||
| Index | Value | Change Week | Change YTD | Trend1 |
|---|---|---|---|---|
| Dow | 26447.1 |
-0.04% | 6.99% | Up |
| NASDAQ | 7788.45 |
-3.21% | 12.82% | Up |
| S&P 500 | 2885.57 |
-0.97% | 7.93% | Up |
|
1The Market Trend is derived from
our proprietary market model. The market model is described on
the site here.
2The site also shows industry rankings based on fundamentals, combined technical and fundamentals, and on price alone. The site also shows daily industry movements. |
||||
| 1 Week | 13 Weeks | 26 Weeks | Year-to-Date |
|---|---|---|---|
| Dow Jones |
Dow Jones 1.3 % |
NASDAQ Composite 12.63 % |
NASDAQ Composite 12.82 % |
| 1 Week | 3 Weeks | 13 Weeks | 26 Weeks |
|---|---|---|---|
| Manufactured Housing |
Auto Parts Stores |
Auto Parts Stores |
Manufactured Housing |
| Foreign Utilities 102 |
Auto Parts Wholesale 186 |
Cleaning Products 178 |
Basic Materials Wholesale 190 |
| Charts of each industry rank and performance over 12 months are available on the site | |||
If you received this newsletter from a friend and you would like to receive it regularly please go to the BreakoutWatch.com site and you will then be able to register to receive the newsletter.
Copyright (c) 10/06/2018 NBIcharts, LLC dba BreakoutWatch.com. All
rights reserved.
" BreakoutWatch," the BreakoutWatch.com "eye" logo, and the slogan
"tomorrow's breakouts today" are service marks of NBIcharts LLC. All
other marks are the property of their respective owners, and are used
for descriptive purposes only.
BreakoutWatch is not affiliated with Investor's Business Daily or with Mr. William O'Neil. Our site, research and analysis is supported entirely by subscription and is free from advertising.