Breakoutwatch Weekly Summary 01/05/19
You are receiving this email because you are or were a BreakoutWatch.com subscriber, or have subscribed to our weekly newsletter. This newsletter summarizes the breakout events of the week and provides additional guidance that does not fit into our daily format. It is published each weekend.
| Trend Indicators Still Negative as
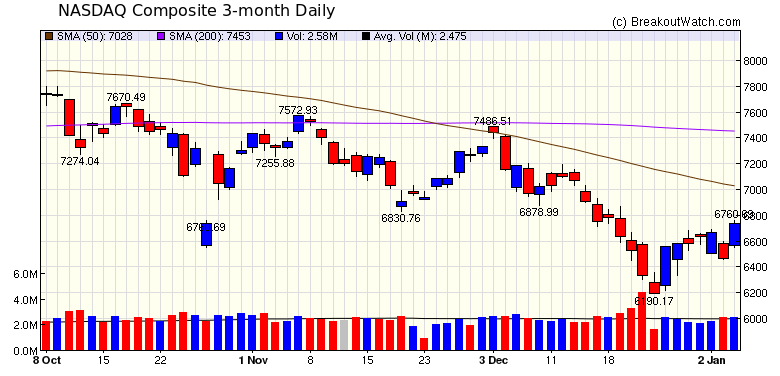
Volatility Constrains Long and Short Position Breakouts Despite a winning week for the NASDAQ our trend indicators remain negative even though Friday delivered a 4.3% gain on above average volume. This followed a 2% loss on Thursday, also on above average volume. Volume earlier in the week was also low due to the holidays and so the indicator remains unconvinced that an upward trend is in place. Nevertheless, Friday's strong jobs report and moderating comments from Fed Chairman Powell may lead investors to believe that Christmas Eve marked the bottom of the current correction. The markets are not clear of concerns over a global recession, led by China, and domestic issues may mean we will continue to see high volatility. Both breakouts and breakdowns failed to deliver satisfying gains as volatility swings whipsawed both long and short positions.  |
No new features this week |
|
Our latest strategy
suggestions are here.
|
| List | Breakouts | Avg. Gain |
|---|---|---|
| CWH | 1 | -0.11 |
| SQZ | 6 | 2.57 |
| HTF | 0 | |
| HSB | 0 | |
| DB | 0 |
| Brkout Date | Symbol | Base | Squeeze | Brkout Price | Brkout Day Close | RS Rank* | Last Close | Current % off BOP | Gain at Intraday High |
|---|---|---|---|---|---|---|---|---|---|
| 2019-01-03 | BSBR | SQZ | y | 12.17 | 12.39 | 96 | 12.8 | 5.18% | 6.08% |
| 2019-01-04 | ARCO | SQZ | y | 8.08 | 8.37 | 89 | 8.37 | 3.59% | 4.33% |
| 2019-01-04 | BRG | SQZ | y | 9.55 | 9.89 | 90 | 9.89 | 3.56% | 4.4% |
| 2019-01-04 | RBA | SQZ | y | 33.51 | 34.13 | 81 | 34.13 | 1.85% | 2.57% |
| 2019-01-02 | AEH | SQZ | y | 25.17 | 25.33 | 82 | 25.41 | 0.95% | 1.19% |
| 2019-01-03 | AEH | SQZ | y | 25.34 | 25.44 | 84 | 25.41 | 0.28% | 0.51% |
| 2019-01-02 | CIVI | CWH | n | 17.65 | 17.66 | 92 | 17.63 | -0.11% | 0.23% |
| *RS Rank on day before breakout. | |||||||||
| List | Breakdowns | Avg. Gain |
|---|---|---|
| HST | 3 |
-0.67% |
| SS | 3 | 2.00% |
| B'down Date | Symbol | Base | B'down Price | B'down Day Close | B'down Vol % ADV | B'Down Day % Gain | Last Close | Gain % at Last Close | Gain % at Intraday Low |
|---|---|---|---|---|---|---|---|---|---|
| 01/04/19 | BGNE | SS | 128.30 | 127.86 | 180.3 | 0.3 % | 127.86 | 0.3 % | 6.4 % |
| 01/04/19 | NNN | HS | 47.89 | 47.81 | 114.4 | 0.2 % | 47.81 | 0.2 % | 0.6 % |
| 01/03/19 | BGNE | SS | 129.99 | 128.30 | 474.6 | 1.3 % | 127.86 | 1.7 % | 20.4 % |
| 01/03/19 | SAVE | HS | 54.77 | 53.96 | 104.7 | 1.5 % | 56.1 | -2.4 % | 4.3 % |
| 01/02/19 | SMAR | SS | 24.56 | 24.21 | 189.3 | 1.4 % | 23.62 | 4 % | 10.3 % |
| 01/02/19 | NNN | HS | 47.89 | 47.29 | 142.8 | 1.3 % | 47.81 | 0.2 % | 1.9 % |
| Symbol | BO Price |
BO Vol. |
Company | Industry | RS Rank |
Last Close |
|---|---|---|---|---|---|---|
| These stocks meet our suggested screening factors
for our Cup and Handle Chart Pattern watchlist. See Revised Rules for Trading Cup and Handle Breakouts |
||||||
| Index | Value | Change Week | Change YTD | Trend1 |
|---|---|---|---|---|
| Dow | 23433.2 |
1.61% | 0.45% | Down |
| NASDAQ | 6738.86 |
2.34% | 1.56% | Down |
| S&P 500 | 2531.94 |
1.86% | 1% | Down |
|
1The Market Trend is derived from
our proprietary market model. The market model is described on
the site here.
2The site also shows industry rankings based on fundamentals, combined technical and fundamentals, and on price alone. The site also shows daily industry movements. |
||||
| 1 Week | 13 Weeks | 26 Weeks | Year-to-Date |
|---|---|---|---|
| NASDAQ Composite |
Dow Jones -11.4 % |
Dow Jones -4.18 % |
NASDAQ Composite 1.56 % |
| 1 Week | 3 Weeks | 13 Weeks | 26 Weeks |
|---|---|---|---|
| Foreign Utilities |
Foreign Utilities |
Foreign Utilities |
Auto Parts Stores |
| Long-Term Care Facilities 79 |
Aerospace/Defense - Major Diversified 81 |
Synthetics 197 |
Synthetics 212 |
| Charts of each industry rank and performance over 12 months are available on the site | |||
If you received this newsletter from a friend and you would like to receive it regularly please go to the BreakoutWatch.com site and you will then be able to register to receive the newsletter.
Copyright (c) 01/05/2019 NBIcharts, LLC dba BreakoutWatch.com. All
rights reserved.
" BreakoutWatch," the BreakoutWatch.com "eye" logo, and the slogan
"tomorrow's breakouts today" are service marks of NBIcharts LLC. All
other marks are the property of their respective owners, and are used
for descriptive purposes only.
BreakoutWatch is not affiliated with Investor's Business Daily or with Mr. William O'Neil. Our site, research and analysis is supported entirely by subscription and is free from advertising.