Breakoutwatch Weekly Summary 02/02/19
You are receiving this email because you are or were a BreakoutWatch.com subscriber, or have subscribed to our weekly newsletter. This newsletter summarizes the breakout events of the week and provides additional guidance that does not fit into our daily format. It is published each weekend.
| 36 Breakouts Confirm Rally is
Strong As the table of confirmed breakouts below shows, there were a near record number of breakouts this week, many of which maintained substantial gains until Friday's close. The cup and handle pattern delivered the most with 22 breakouts followed by the Volatility Squeeze with 11. The week started slowly but was given new energy on Wednesday by Fed Chairman Powell who said "The case for raising rates has weakened somewhat" and left interest rates unchanged. The result was two successive accumulation days before Friday saw some profit taking, despite a very strong labor market report. Although the NASDAQ lagged the S&P 500 this week, it remains the strongest of the the three major indexes year to date. 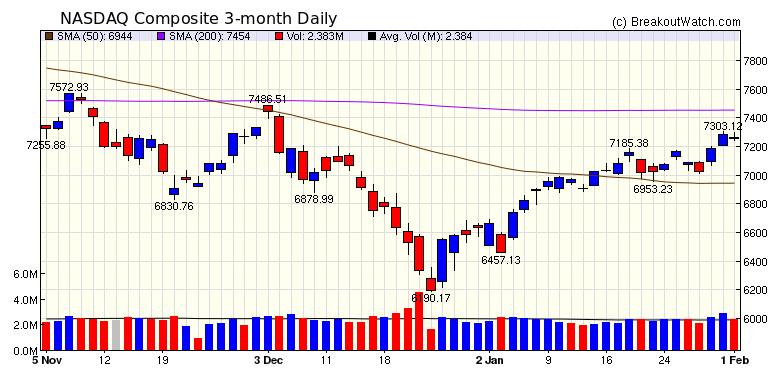 |
| No new features this week |
|
Our latest strategy
suggestions are here.
|
| List | Breakouts | Avg. Gain |
|---|---|---|
| CWH | 22 | 3.46 |
| SQZ | 11 | 4.69 |
| HTF | 0 | |
| HSB | 0 | |
| DB | 3 | 6.56 |
| Brkout Date | Symbol | Base | Squeeze | Brkout Price | Brkout Day Close | RS Rank* | Last Close | Current % off BOP | Gain at Intraday High |
|---|---|---|---|---|---|---|---|---|---|
| 2019-01-31 | FLWS | CWH | n | 13.57 | 15.95 | 86 | 16.35 | 20.49% | 24.72% |
| 2019-01-30 | NOW | CWH | n | 192.79 | 194 | 87 | 221.51 | 14.9% | 18.48% |
| 2019-01-31 | COUP | CWH | n | 80.66 | 86.96 | 97 | 92 | 14.06% | 14.17% |
| 2019-01-30 | NIO | SQZ | y | 6.95 | 7.46 | 86 | 7.9 | 13.67% | 16.69% |
| 2019-01-30 | MRCY | DB | n | 52.99 | 58.26 | 93 | 58.11 | 9.66% | 14.83% |
| 2019-01-31 | CDXS | SQZ | y | 17.70 | 18.82 | 96 | 19.37 | 9.44% | 15.54% |
| 2019-01-28 | AGYS | SQZ | y | 16.43 | 17.88 | 89 | 17.92 | 9.07% | 13.57% |
| 2019-01-28 | CYBR | CWH | n | 81.88 | 84.13 | 96 | 88.48 | 8.06% | 8.78% |
| 2019-01-31 | NIO | SQZ | y | 7.47 | 7.88 | 93 | 7.9 | 5.76% | 8.57% |
| 2019-01-31 | MDC | SQZ | y | 31.19 | 32.93 | 80 | 32.83 | 5.26% | 7.31% |
| 2019-01-28 | ATAX | CWH | n | 6.29 | 6.4 | 83 | 6.61 | 5.09% | 5.41% |
| 2019-01-29 | TDG | DB | n | 374.35 | 375.72 | 77 | 393.23 | 5.04% | 5.64% |
| 2019-01-30 | BA | DB | n | 369.00 | 387.72 | 81 | 387.43 | 4.99% | 6.45% |
| 2019-02-01 | LPLA | CWH | n | 71.65 | 75.06 | 87 | 75.06 | 4.76% | 7.34% |
| 2019-01-31 | FICO | CWH | n | 218.41 | 225.2 | 90 | 228.51 | 4.62% | 4.63% |
| 2019-01-31 | MSCI | CWH | n | 166.15 | 170.27 | 84 | 172.9 | 4.06% | 5.03% |
| 2019-01-31 | WK | CWH | n | 40.26 | 41.9 | 97 | 41.86 | 3.97% | 6.16% |
| 2019-01-29 | LSI | SQZ | y | 95.66 | 96.76 | 83 | 97.9 | 2.34% | 3.42% |
| 2019-01-30 | NHC | SQZ | y | 78.82 | 79.47 | 88 | 80.56 | 2.21% | 2.94% |
| 2019-01-31 | REGN | CWH | n | 421.99 | 429.27 | 92 | 430.15 | 1.93% | 2.21% |
| 2019-01-31 | KIDS | CWH | y | 35.50 | 36.27 | 96 | 36.1 | 1.69% | 6.56% |
| 2019-01-31 | AWR | SQZ | y | 65.81 | 67.72 | 86 | 66.9 | 1.66% | 3.25% |
| 2019-01-31 | NHC | SQZ | y | 79.48 | 80.33 | 88 | 80.56 | 1.36% | 2.08% |
| 2019-02-01 | ERIE | CWH | n | 150.00 | 152.01 | 91 | 152.01 | 1.34% | 1.34% |
| 2019-01-31 | ACIW | CWH | n | 29.35 | 29.56 | 90 | 29.56 | 0.72% | 0.99% |
| 2019-02-01 | HUBS | CWH | n | 158.66 | 159.72 | 95 | 159.72 | 0.67% | 1.41% |
| 2019-01-31 | NCI | CWH | n | 25.74 | 25.92 | 91 | 25.86 | 0.47% | 1.2% |
| 2019-01-31 | LII | CWH | n | 228.72 | 229.28 | 80 | 229.78 | 0.46% | 0.97% |
| 2019-01-31 | AWK | CWH | n | 94.83 | 95.67 | 80 | 95.21 | 0.4% | 1.38% |
| 2019-01-30 | IDTI | SQZ | y | 48.60 | 48.77 | 95 | 48.79 | 0.39% | 0.68% |
| 2019-01-30 | CHMI | SQZ | y | 18.52 | 18.53 | 86 | 18.59 | 0.38% | 0.56% |
| 2019-02-01 | DNB | CWH | n | 144.79 | 144.85 | 85 | 144.85 | 0.04% | 0.04% |
| 2019-01-31 | AEE | CWH | n | 69.03 | 69.36 | 86 | 68.85 | -0.26% | 0.85% |
| 2019-01-31 | BLL | CWH | n | 52.18 | 52.28 | 93 | 52.03 | -0.29% | 1.82% |
| 2019-01-31 | JKS | CWH | n | 16.00 | 16.66 | 96 | 15.15 | -5.31% | 5.81% |
| 2019-01-29 | MCS | CWH | n | 43.67 | 44.78 | 96 | 41.11 | -5.86% | 4.92% |
| *RS Rank on day before breakout. | |||||||||
| Symbol | BO Price |
BO Vol. |
Company | Industry | RS Rank |
Last Close |
|---|---|---|---|---|---|---|
| No stocks met our suggested screening factors for
our Cup and Handle Chart Pattern watchlist. See Revised Rules for Trading Cup and Handle Breakouts |
||||||
| Index | Value | Change Week | Change YTD | Trend1 |
|---|---|---|---|---|
| Dow | 25063.9 |
1.32% | 7.44% | Up |
| NASDAQ | 7263.87 |
1.38% | 9.47% | Up |
| S&P 500 | 2706.53 |
1.57% | 7.97% | Up |
|
1The Market Trend is derived from
our proprietary market model. The market model is described on
the site here.
2The site also shows industry rankings based on fundamentals, combined technical and fundamentals, and on price alone. The site also shows daily industry movements. |
||||
| 1 Week | 13 Weeks | 26 Weeks | Year-to-Date |
|---|---|---|---|
| S&P 500 |
S&P 500 -0.82 % |
Dow Jones -1.57 % |
NASDAQ Composite 9.47 % |
| 1 Week | 3 Weeks | 13 Weeks | 26 Weeks |
|---|---|---|---|
| Foreign Utilities |
Foreign Utilities |
Foreign Utilities |
Auto Parts Stores |
| Music & Video Stores 213 |
Music & Video Stores 210 |
Synthetics 175 |
Music & Video Stores 214 |
| Charts of each industry rank and performance over 12 months are available on the site | |||
If you received this newsletter from a friend and you would like to receive it regularly please go to the BreakoutWatch.com site and you will then be able to register to receive the newsletter.
Copyright (c) 02/02/2019 NBIcharts, LLC dba BreakoutWatch.com. All
rights reserved.
" BreakoutWatch," the BreakoutWatch.com "eye" logo, and the slogan
"tomorrow's breakouts today" are service marks of NBIcharts LLC. All
other marks are the property of their respective owners, and are used
for descriptive purposes only.
BreakoutWatch is not affiliated with Investor's Business Daily or with Mr. William O'Neil. Our site, research and analysis is supported entirely by subscription and is free from advertising.