Breakoutwatch Weekly Summary 03/09/19
You are receiving this email because you are or were a BreakoutWatch.com subscriber, or have subscribed to our weekly newsletter. This newsletter summarizes the breakout events of the week and provides additional guidance that does not fit into our daily format. It is published each weekend.
| Economic Outlook Stymies New
Breakouts The NASDAQ Composite slipped 1.6% compared to last Friday's close as signs of slowing economic growth led traders to question the underlying strength of the recent recovery. Slowing economic growth at home and abroad, particularly in Europe and China, combined with continued uncertainty about a US-China trade deal, led to profit taking beginning on Monday and continued throughout the week. Surprising low job growth figures, just 20,000 new jobs in February, caused a sell-off early on Friday.The NASDAQ did recover from its lows but still closed for a loss. Failure to hold above the 200 day moving average introduced a bearish technical factor in addition to the weakening economic situation. The result was that there were far fewer breakouts this week, just 7 compared to 26 last week. Although our trend indicator remains positive, clearly there are doubts about the direction the market is taking. The next technical support level is at the 50 day moving average, just 3% below Friday's close. 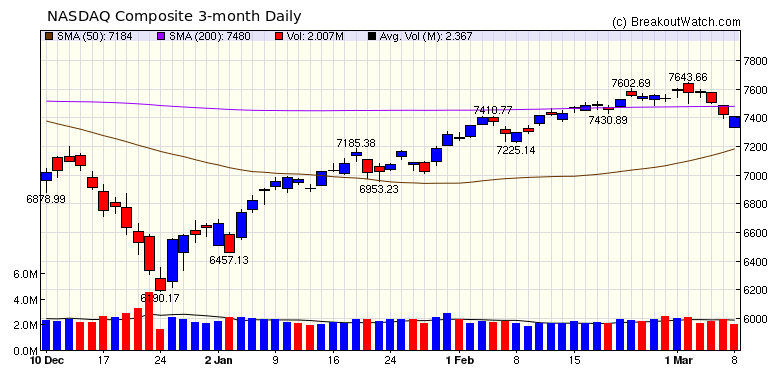 |
| No new features this week |
|
Our latest strategy
suggestions are here.
Since issuing our first emails of
stocks meeting our new Buy at Open strategy criteria on
February 19, our picks have hit a headwind as the market went
from flat to negative. Six stocks could not be bought at the
next open as they opened below the previous day's breakout
price (BoP). The remainder were stopped out using the upper
true range value from the previous day, as the strategy
provides for, but only one, JKS, showed a profit.
|
| List | Breakouts | Avg. Gain |
|---|---|---|
| CWH | 5 | 1.74 |
| SQZ | 2 | 0.81 |
| HTF | 0 | |
| HSB | 0 | |
| DB | 0 |
| Brkout Date | Symbol | Base | Squeeze | Brkout Price | Brkout Day Close | RS Rank* | Last Close | Current % off BOP | Gain at Intraday High |
|---|---|---|---|---|---|---|---|---|---|
| 2019-03-08 | UPLD | CWH | n | 35.60 | 39.91 | 84 | 39.91 | 12.11% | 12.42% |
| 2019-03-07 | PNM | CWH | n | 44.93 | 44.94 | 85 | 45.86 | 2.07% | 2.16% |
| 2019-03-07 | DLTR | SQZ | y | 100.36 | 103.16 | 85 | 102.4 | 2.03% | 3.82% |
| 2019-03-08 | WBC | CWH | n | 142.00 | 142.59 | 86 | 142.59 | 0.42% | 3.17% |
| 2019-03-04 | REPH | SQZ | y | 9.43 | 9.55 | 95 | 9.39 | -0.42% | 9.44% |
| 2019-03-05 | CCK | CWH | n | 55.38 | 55.55 | 85 | 54.62 | -1.37% | 0.99% |
| 2019-03-04 | AMRC | CWH | n | 17.00 | 17.27 | 94 | 16.23 | -4.53% | 6.18% |
| *RS Rank on day before breakout. | |||||||||
| Symbol | BO Price |
BO Vol. |
Company | Industry | RS Rank |
Last Close |
|---|---|---|---|---|---|---|
| No stocks met our suggested screening factors for
our Cup and Handle Chart Pattern watchlist. See Revised Rules for Trading Cup and Handle Breakouts |
||||||
| Index | Value | Change Week | Change YTD | Trend1 |
|---|---|---|---|---|
| Dow | 25450.2 |
-2.23% | 9.1% | Up |
| NASDAQ | 7408.14 |
-1.59% | 11.65% | Up |
| S&P 500 | 2743.07 |
-1.78% | 9.42% | Up |
|
1The Market Trend is derived from
our proprietary market model. The market model is described on
the site here.
2The site also shows industry rankings based on fundamentals, combined technical and fundamentals, and on price alone. The site also shows daily industry movements. |
||||
| 1 Week | 13 Weeks | 26 Weeks | Year-to-Date |
|---|---|---|---|
| S&P 500 |
NASDAQ Composite 4.35 % |
Dow Jones -1.8 % |
NASDAQ Composite 11.65 % |
| 1 Week | 3 Weeks | 13 Weeks | 26 Weeks |
|---|---|---|---|
| Foreign Utilities |
Foreign Utilities |
Foreign Utilities |
Auto Parts Stores |
| Lodging 49 |
Healthcare Information Services 67 |
Music & Video Stores 178 |
Music & Video Stores 214 |
| Charts of each industry rank and performance over 12 months are available on the site | |||
If you received this newsletter from a friend and you would like to receive it regularly please go to the BreakoutWatch.com site and you will then be able to register to receive the newsletter.
Copyright (c) 03/09/2019 NBIcharts, LLC dba BreakoutWatch.com. All
rights reserved.
" BreakoutWatch," the BreakoutWatch.com "eye" logo, and the slogan
"tomorrow's breakouts today" are service marks of NBIcharts LLC. All
other marks are the property of their respective owners, and are used
for descriptive purposes only.
BreakoutWatch is not affiliated with Investor's Business Daily or with Mr. William O'Neil. Our site, research and analysis is supported entirely by subscription and is free from advertising.