Breakoutwatch Weekly Summary 04/27/19
You are receiving this email because you are or were a BreakoutWatch.com subscriber, or have subscribed to our weekly newsletter. This newsletter summarizes the breakout events of the week and provides additional guidance that does not fit into our daily format. It is published each weekend.
| New NASDAQ High Brings Improved
Breakout Performance The NASDAQ (and the S&P 500) set new closing highs this week while the DJI declined 0.1% following disappointing results from 3M, Intel,, and Exxon Mobil. Strong earnings results from technology companies like Amazon (AMZN), Facebook (FB), and Microsoft (MSFT), helped move the NASDAQ to its new high. While the US economy appears strong with 1st Q GDP giving a surprise advance of 3.2% when the expectation was just 1.9%, the overseas picture looks bleak with slowdowns in China, Germany, South Korea and Japan. Perhaps this explains why US stocks are rising but doing so on less than average volume for the last 4 weeks, as the NASDAQ chart shows. This weakness in volume may cause a test of support for the new levels. We recorded 21 breakouts this week with Cup and Handle (CWH) and Volatility Squeeze (SQZ) stocks almost equally represented but with SQZ giving the better average return. Only 3 of the 21 stocks closed below their breakout price. 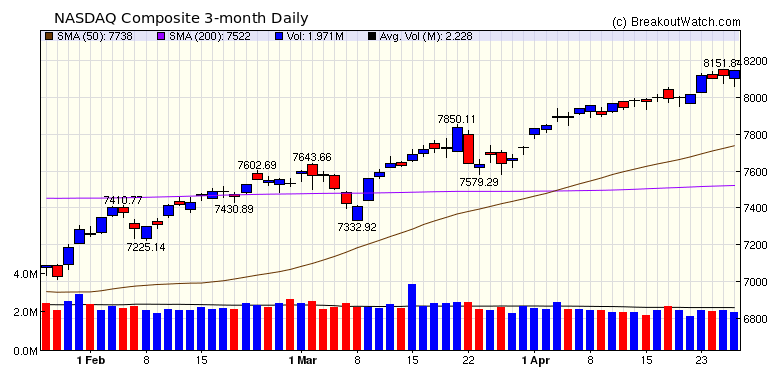 |
| No new features this week |
|
Our latest strategy
suggestions are here.
|
| List | Breakouts | Avg. Gain |
|---|---|---|
| CWH | 11 | 3.23 |
| SQZ | 10 | 4.42 |
| HTF | 0 | |
| HSB | 0 | |
| DB | 0 |
| Brkout Date | Symbol | Base | Squeeze | Brkout Price | Brkout Day Close | RS Rank* | Last Close | Current % off BOP | Gain at Intraday High |
|---|---|---|---|---|---|---|---|---|---|
| 2019-04-24 | CATS | SQZ | y | 13.83 | 15 | 98 | 15.97 | 15.47% | 15.55% |
| 2019-04-23 | CSL | CWH | n | 128.01 | 128.43 | 0 | 139.95 | 9.33% | 10.54% |
| 2019-04-24 | GPI | CWH | n | 73.20 | 74.66 | 84 | 79.45 | 8.54% | 8.93% |
| 2019-04-24 | TER | CWH | n | 45.57 | 47.99 | 90 | 48.76 | 7% | 8.69% |
| 2019-04-25 | CATS | SQZ | y | 15.01 | 15.19 | 98 | 15.97 | 6.4% | 6.46% |
| 2019-04-23 | QTWO | SQZ | y | 70.04 | 72.25 | 0 | 74.5 | 6.37% | 7.08% |
| 2019-04-26 | MDCO | SQZ | y | 29.81 | 31.58 | 80 | 31.58 | 5.94% | 8.19% |
| 2019-04-25 | FCN | CWH | n | 81.58 | 83.63 | 88 | 85.25 | 4.5% | 5.2% |
| 2019-04-26 | SPSC | SQZ | y | 102.53 | 107.13 | 91 | 107.13 | 4.49% | 12.16% |
| 2019-04-23 | CSIQ | SQZ | y | 19.59 | 20.26 | 0 | 20.27 | 3.47% | 5.92% |
| 2019-04-25 | CVI | CWH | n | 44.22 | 45.82 | 82 | 45.63 | 3.19% | 4.52% |
| 2019-04-26 | CGC | CWH | n | 48.70 | 49.91 | 96 | 49.91 | 2.48% | 3.55% |
| 2019-04-26 | UTL | SQZ | y | 55.67 | 56.79 | 80 | 56.79 | 2.01% | 6.31% |
| 2019-04-25 | SUI | SQZ | y | 120.67 | 122.24 | 87 | 122.11 | 1.19% | 2.38% |
| 2019-04-25 | CMCSA | CWH | n | 42.83 | 42.93 | 86 | 43.08 | 0.58% | 2.64% |
| 2019-04-26 | CECO | CWH | n | 18.29 | 18.38 | 90 | 18.38 | 0.49% | 0.49% |
| 2019-04-24 | SWI | SQZ | y | 19.48 | 19.74 | 87 | 19.51 | 0.15% | 2.87% |
| 2019-04-26 | ULBI | CWH | n | 11.54 | 11.55 | 94 | 11.55 | 0.09% | 0.52% |
| 2019-04-24 | JOBS | CWH | n | 93.82 | 95.02 | 91 | 93.79 | -0.03% | 2.31% |
| 2019-04-24 | AMKR | CWH | n | 9.23 | 9.5 | 85 | 9.17 | -0.65% | 5.53% |
| 2019-04-24 | PFPT | SQZ | y | 126.20 | 127.65 | 84 | 124.55 | -1.31% | 4.14% |
| *RS Rank on day before breakout. | |||||||||
| Symbol | BO Price |
BO Vol. |
Company | Industry | RS Rank |
Last Close |
|---|---|---|---|---|---|---|
| PACB | 7.42 | 1,941,560 | N/A | Biotechnology | 98 | 7.35 |
| FRO | 8.24 | 707,384 | N/A | Shipping | 97 | 8.04 |
| NGL | 14.83 | 1,395,015 | N/A | Oil & Gas Refining & Marketing | 91 | 14.50 |
| VIAV | 13.38 | 3,110,260 | N/A | Communication Equipment | 90 | 13.24 |
| SSW | 10.50 | 1,319,360 | N/A | Shipping | 86 | 10.12 |
| GOLD | 14.54 | 22,245,584 | N/A | Gold | 86 | 13.00 |
| DRNA | 15.33 | 832,834 | N/A | Biotechnology | 84 | 13.31 |
| MX | 10.45 | 525,858 | N/A | Semiconductor - Specialized | 84 | 9.34 |
| KIM | 18.64 | 4,922,458 | N/A | REIT - Retail | 81 | 17.81 |
| BRX | 18.54 | 4,132,912 | N/A | REIT - Retail | 81 | 18.05 |
| These stocks meet our suggested screening factors
for our Cup and Handle Chart Pattern watchlist. See Revised Rules for Trading Cup and Handle Breakouts |
||||||
| Index | Value | Change Week | Change YTD | Trend1 |
|---|---|---|---|---|
| Dow | 26543.3 |
-0.06% | 13.79% | Up |
| NASDAQ | 8146.4 |
1.85% | 22.77% | Up |
| S&P 500 | 2939.88 |
1.2% | 17.27% | Up |
|
1The Market Trend is derived from
our proprietary market model. The market model is described on
the site here.
2The site also shows industry rankings based on fundamentals, combined technical and fundamentals, and on price alone. The site also shows daily industry movements. |
||||
| 1 Week | 13 Weeks | 26 Weeks | Year-to-Date |
|---|---|---|---|
| NASDAQ Composite |
NASDAQ Composite 13.7 % |
NASDAQ Composite 13.66 % |
NASDAQ Composite 22.77 % |
| 1 Week | 3 Weeks | 13 Weeks | 26 Weeks |
|---|---|---|---|
| Personal Computers |
Personal Computers |
Foreign Utilities |
Auto Parts Stores |
| Aerospace/Defense - Major Diversified 112 |
Personal Products 93 |
Music & Video Stores 212 |
Semiconductor - Memory Chips 172 |
| Charts of each industry rank and performance over 12 months are available on the site | |||
If you received this newsletter from a friend and you would like to receive it regularly please go to the BreakoutWatch.com site and you will then be able to register to receive the newsletter.
Copyright (c) 04/27/2019 NBIcharts, LLC dba BreakoutWatch.com. All
rights reserved.
" BreakoutWatch," the BreakoutWatch.com "eye" logo, and the slogan
"tomorrow's breakouts today" are service marks of NBIcharts LLC. All
other marks are the property of their respective owners, and are used
for descriptive purposes only.
BreakoutWatch is not affiliated with Investor's Business Daily or with Mr. William O'Neil. Our site, research and analysis is supported entirely by subscription and is free from advertising.