Breakoutwatch Weekly Summary 05/11/19
You are receiving this email because you are or were a BreakoutWatch.com subscriber, or have subscribed to our weekly newsletter. This newsletter summarizes the breakout events of the week and provides additional guidance that does not fit into our daily format. It is published each weekend.
| NASDAQ Bounces Off Support Level.
Upward Trend Continues Except for DOW After a week of trade uncertainty and falling prices the NASDAQ found support at the 50 day average price level on both Thursday and Friday. Although the 25% tariffs on Chinese imports went into effect on Friday causing early selling, the index recovered for a 0.4% gain on the day. Nevertheless, the index was left with a 3% loss for the week. Friday's recovery came after optimistic rhetoric from the Administration, but uncertainty is likely to continue as President Trump threatens to widen the tariffs on a further $325 billion of Chinese imports. Our trend indicators remain positive for the NASDAQ and S&P 500. The DJI fell heavily on Tuesday and is below the 50 day support level and could soon test the 200 day average level. Our tend indicator for the DJI is now negative. 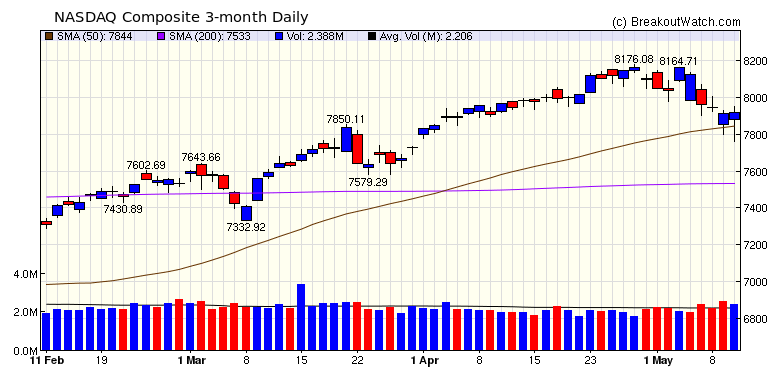 Despite the negative trend for the
week, there were several strong breakouts with the Volatility
Squeeze pattern again delivering the best returns.
|
| No new features this week |
|
Our latest strategy
suggestions are here.
|
| List | Breakouts | Avg. Gain |
|---|---|---|
| CWH | 12 | 1.68 |
| SQZ | 8 | 6.06 |
| HTF | 0 | |
| HSB | 0 | |
| DB | 0 |
| Brkout Date | Symbol | Base | Squeeze | Brkout Price | Brkout Day Close | RS Rank* | Last Close | Current % off BOP | Gain at Intraday High |
|---|---|---|---|---|---|---|---|---|---|
| 2019-05-09 | CECE | SQZ | y | 8.01 | 9.35 | 89 | 9.42 | 17.6% | 20.47% |
| 2019-05-07 | MNOV | CWH | n | 11.71 | 12.09 | 87 | 12.8 | 9.31% | 10.63% |
| 2019-05-09 | OZM | SQZ | y | 16.23 | 17.18 | 84 | 17.51 | 7.89% | 11.52% |
| 2019-05-07 | SERV | CWH | n | 49.89 | 53.8 | 90 | 53.57 | 7.38% | 13.25% |
| 2019-05-08 | GNE | SQZ | y | 9.11 | 9.4 | 96 | 9.76 | 7.14% | 8.45% |
| 2019-05-09 | GTLS | SQZ | y | 86.10 | 93.16 | 88 | 91.03 | 5.73% | 8.62% |
| 2019-05-06 | VLRS | SQZ | y | 9.36 | 9.9 | 93 | 9.71 | 3.74% | 6.73% |
| 2019-05-08 | HSIC | SQZ | y | 66.72 | 68.71 | 86 | 68.9 | 3.27% | 4.42% |
| 2019-05-09 | ANIP | SQZ | y | 71.01 | 73.17 | 91 | 73.19 | 3.07% | 4.21% |
| 2019-05-10 | CYTK | CWH | n | 9.79 | 10.07 | 90 | 10.07 | 2.86% | 6.13% |
| 2019-05-10 | SAM | CWH | n | 338.70 | 347.83 | 91 | 347.83 | 2.7% | 3.51% |
| 2019-05-10 | FLY | CWH | n | 15.01 | 15.41 | 85 | 15.41 | 2.66% | 3.93% |
| 2019-05-09 | CECO | CWH | y | 18.55 | 19.31 | 92 | 18.95 | 2.16% | 7.12% |
| 2019-05-08 | TTEC | CWH | n | 36.89 | 38.25 | 86 | 37.24 | 0.95% | 7.97% |
| 2019-05-07 | ENFC | CWH | n | 29.65 | 29.67 | 84 | 29.67 | 0.07% | 0.1% |
| 2019-05-10 | ANIP | SQZ | y | 73.18 | 73.19 | 93 | 73.19 | 0.01% | 1.12% |
| 2019-05-06 | APC | CWH | n | 73.62 | 75.49 | 93 | 73.06 | -0.76% | 3.55% |
| 2019-05-06 | BRKS | CWH | n | 39.37 | 39.77 | 91 | 38.93 | -1.12% | 2.13% |
| 2019-05-09 | JCOM | CWH | n | 90.28 | 90.6 | 82 | 88.99 | -1.43% | 0.79% |
| 2019-05-06 | IT | CWH | y | 161.24 | 161.49 | 84 | 153.855 | -4.58% | 0.38% |
| *RS Rank on day before breakout. | |||||||||
| Symbol | BO Price |
BO Vol. |
Company | Industry | RS Rank |
Last Close |
|---|---|---|---|---|---|---|
| VHC | 6.90 | 711,009 | VirnetX Holding Corp | Internet Software & Services | 98 | 6.60 |
| FRO | 8.30 | 669,927 | Frontline Ltd. | Shipping | 97 | 7.90 |
| VSLR | 7.33 | 1,139,854 | Vivint Solar, Inc. | Semiconductor - Specialized | 94 | 6.42 |
| NGL | 14.83 | 1,099,378 | NGL Energy Partners LP | Oil & Gas Refining & Marketing | 92 | 13.82 |
| VIAV | 14.00 | 3,196,658 | Viavi Solutions Inc. | Communication Equipment | 91 | 13.64 |
| SSW | 10.70 | 1,387,844 | Seaspan Corporation | Shipping | 84 | 9.80 |
| BSMX | 8.74 | 3,121,672 | Banco Santander (México), S.A. | Foreign Regional Banks | 84 | 7.96 |
| NAVI | 14.01 | 2,450,474 | Navient Corporation | Credit Services | 83 | 13.82 |
| BRX | 18.54 | 3,644,067 | Brixmor Property Group Inc. | REIT - Retail | 82 | 18.25 |
| RUN | 17.44 | 1,716,010 | Sunrun Inc. | Semiconductor - Specialized | 82 | 15.07 |
| These stocks meet our suggested screening factors
for our Cup and Handle Chart Pattern watchlist. See Revised Rules for Trading Cup and Handle Breakouts |
||||||
| Index | Value | Change Week | Change YTD | Trend1 |
|---|---|---|---|---|
| Dow | 25942.4 |
-2.12% | 11.21% | Down |
| NASDAQ | 7916.94 |
-3.03% | 19.32% | Up |
| S&P 500 | 2881.4 |
-2.18% | 14.94% | Up |
|
1The Market Trend is derived from
our proprietary market model. The market model is described on
the site here.
2The site also shows industry rankings based on fundamentals, combined technical and fundamentals, and on price alone. The site also shows daily industry movements. |
||||
| 1 Week | 13 Weeks | 26 Weeks | Year-to-Date |
|---|---|---|---|
| Dow Jones |
NASDAQ Composite 8.48 % |
NASDAQ Composite 6.89 % |
NASDAQ Composite 19.32 % |
| 1 Week | 3 Weeks | 13 Weeks | 26 Weeks |
|---|---|---|---|
| Personal Computers |
Personal Computers |
Foreign Utilities |
Auto Parts Stores |
| Hospitals 61 |
Aerospace/Defense - Major Diversified 149 |
Diversified Computer Systems 161 |
Synthetics 215 |
| Charts of each industry rank and performance over 12 months are available on the site | |||
If you received this newsletter from a friend and you would like to receive it regularly please go to the BreakoutWatch.com site and you will then be able to register to receive the newsletter.
Copyright (c) 05/11/2019 NBIcharts, LLC dba BreakoutWatch.com. All
rights reserved.
" BreakoutWatch," the BreakoutWatch.com "eye" logo, and the slogan
"tomorrow's breakouts today" are service marks of NBIcharts LLC. All
other marks are the property of their respective owners, and are used
for descriptive purposes only.
BreakoutWatch is not affiliated with Investor's Business Daily or with Mr. William O'Neil. Our site, research and analysis is supported entirely by subscription and is free from advertising.