Breakoutwatch Weekly Summary 06/01/19
You are receiving this email because you are or were a BreakoutWatch.com subscriber, or have subscribed to our weekly newsletter. This newsletter summarizes the breakout events of the week and provides additional guidance that does not fit into our daily format. It is published each weekend.
| Bearish HST Confirmed; Recession
Fears Increase. The NASDAQ Composite closed below the neckline of a head and shoulders top pattern on Wednesday confirming the completion of the bearish pattern. On Friday, the index closed below the 200 day support level and is now down 9% from its April 29 high. Friday's result came after the surprise announcement of 5% tariffs on imports from Mexico, which if implemented on June 10, and later increased to 25% on October 1 could have a devastating effect on the economies of both countries. This came after trade negotiations with China continue to be stalled and the impasse threatened to worsen as China put U.S. soybean purchases on hold and threatened to limit exports of rare earth minerals, in which it holds a dominant position. All sectors declined this week as investors sought the safety of U.S. Treasuries. 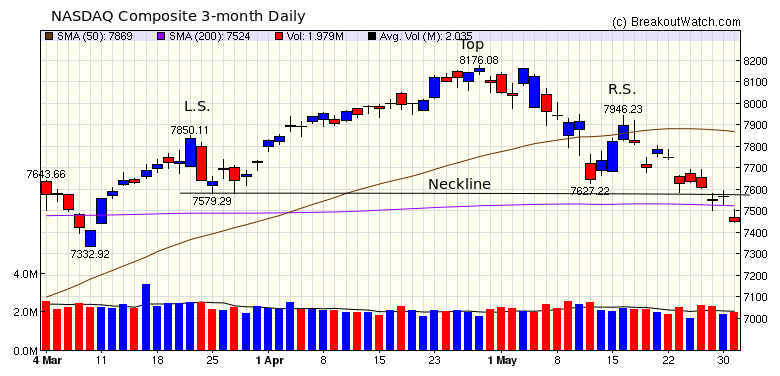 |
| No new features this week |
|
Our latest strategy
suggestions are here.
|
| List | Breakouts | Avg. Gain |
|---|---|---|
| CWH | 3 | -0.7 |
| SQZ | 6 | -0.18 |
| HTF | 0 | |
| HSB | 0 | |
| DB | 0 |
| List | Breakdowns | Avg. Gain |
|---|---|---|
| HST | 0 |
|
| 50 DMA Breakdown | 6 | 1.93 |
| Brkout Date | Symbol | Base | Squeeze | Brkout Price | Brkout Day Close | RS Rank* | Last Close | Current % off BOP | Gain at Intraday High |
|---|---|---|---|---|---|---|---|---|---|
| 2019-05-29 | TBIO | SQZ | y | 9.97 | 10.15 | 81 | 10.48 | 5.12% | 15.35% |
| 2019-05-29 | CHMA | CWH | y | 7.00 | 7.48 | 99 | 7.1 | 1.43% | 10.57% |
| 2019-05-31 | PTY | SQZ | y | 18.16 | 18.25 | 84 | 18.25 | 0.5% | 1.54% |
| 2019-05-28 | CHTR | SQZ | y | 375.01 | 377 | 91 | 376.8 | 0.48% | 1.33% |
| 2019-05-31 | CCI | CWH | y | 129.66 | 130.01 | 87 | 130.01 | 0.27% | 1.73% |
| 2019-05-31 | TRCO | SQZ | y | 46.19 | 46.3 | 88 | 46.3 | 0.24% | 0.37% |
| 2019-05-31 | BRSS | SQZ | y | 43.53 | 43.63 | 95 | 43.63 | 0.23% | 0.32% |
| 2019-05-28 | FATE | CWH | n | 20.04 | 20.25 | 97 | 19.28 | -3.79% | 3.04% |
| 2019-05-28 | CHEF | SQZ | y | 34.30 | 34.56 | 80 | 31.67 | -7.67% | 1.28% |
| *RS Rank on day before breakout. | |||||||||
| Brkdown Date | Symbol | List | Support | Close | Gain % |
|---|---|---|---|---|---|
| 05/28/2019 | ATO | SS | 101.57 | 101.51 | 0.06 % |
| 05/28/2019 | KIM | SS | 17.93 | 17.78 | 0.84 % |
| 05/29/2019 | MOBL | SS | 5.62 | 5.61 | 0.18 % |
| 05/29/2019 | KIM | SS | 17.94 | 17.3 | 3.57 % |
| 05/30/2019 | PFGC | SS | 39.85 | 39.55 | 0.75 % |
| 05/31/2019 | VZ | SS | 57.94 | 54.35 | 6.2 % |
| Symbol | BO Price |
BO Vol. |
Company | Industry | RS Rank |
Last Close |
|---|---|---|---|---|---|---|
| VSLR | 7.37 | 1,129,650 | Vivint Solar - Inc. | Semiconductor - Specialized | 95 | 6.52 |
| CECO | 19.87 | 899,922 | Career Education Corporation | Education & Training Services | 92 | 18.77 |
| BSMX | 8.74 | 3,626,286 | Banco Santander | Foreign Regional Banks | 87 | 7.32 |
| RESI | 11.93 | 607,635 | Front Yard Residential Corporation | REIT - Residential | 85 | 11.44 |
| WSC | 14.66 | 789,954 | WillScot Corporation | Rental & Leasing Services | 83 | 13.58 |
| DOC | 19.07 | 1,771,420 | Physicians Realty Trust | REIT - Healthcare Facilities | 83 | 18.31 |
| NUAN | 18.16 | 2,559,267 | Nuance Communications - Inc. | Application Software | 81 | 17.17 |
| GPRO | 7.65 | 6,540,825 | GoPro - Inc. | Photographic Equipment & Supplies | 81 | 6.30 |
| KIM | 18.64 | 5,396,079 | Kimco Realty Corporation | REIT - Retail | 80 | 17.40 |
| ADTN | 17.81 | 633,448 | ADTRAN - Inc. | Communication Equipment | 80 | 15.68 |
| These stocks meet our suggested screening factors
for our Cup and Handle Chart Pattern watchlist. See Revised Rules for Trading Cup and Handle Breakouts |
||||||
| Index | Value | Change Week | Change YTD | Trend1 |
|---|---|---|---|---|
| Dow | 24815 |
-3.01% | 6.38% | Down |
| NASDAQ | 7453.15 |
-2.41% | 12.33% | Down |
| S&P 500 | 2752.06 |
-2.62% | 9.78% | Down |
|
1The Market Trend is derived from
our proprietary market model. The market model is described on
the site here.
2The site also shows industry rankings based on fundamentals, combined technical and fundamentals, and on price alone. The site also shows daily industry movements. |
||||
| 1 Week | 13 Weeks | 26 Weeks | Year-to-Date |
|---|---|---|---|
| NASDAQ Composite |
S&P 500 -1.87 % |
NASDAQ Composite 1.67 % |
NASDAQ Composite 12.33 % |
| 1 Week | 3 Weeks | 13 Weeks | 26 Weeks |
|---|---|---|---|
| Personal Computers |
Personal Computers |
Foreign Utilities |
Auto Parts Stores |
| Education & Training Services 41 |
Photographic Equipment & Supplies 91 |
Photographic Equipment & Supplies 186 |
Music & Video Stores 203 |
| Charts of each industry rank and performance over 12 months are available on the site | |||
If you received this newsletter from a friend and you would like to receive it regularly please go to the BreakoutWatch.com site and you will then be able to register to receive the newsletter.
Copyright (c) 06/01/2019 NBIcharts, LLC dba BreakoutWatch.com. All
rights reserved.
" BreakoutWatch," the BreakoutWatch.com "eye" logo, and the slogan
"tomorrow's breakouts today" are service marks of NBIcharts LLC. All
other marks are the property of their respective owners, and are used
for descriptive purposes only.
BreakoutWatch is not affiliated with Investor's Business Daily or with Mr. William O'Neil. Our site, research and analysis is supported entirely by subscription and is free from advertising.