Breakoutwatch Weekly Summary 06/15/19
You are receiving this email because you are or were a BreakoutWatch.com subscriber, or have subscribed to our weekly newsletter. This newsletter summarizes the breakout events of the week and provides additional guidance that does not fit into our daily format. It is published each weekend.
| NASDAQ Composite Trends Down;
Caveat Emptor Although the week started with a gap up on Monday in response to the faux deal with Mexico the index failed to breach the resistance level set by the recent bearish head and shoulders pattern. The NASDAQ trended down for the rest of the week as volumes fell away and the rising tensions with Iran saw the index fall 0.5% on Friday. Although the index did gain 0.7% compared to last Friday's close, our trend indicator model senses that the index is in a downward trend. The negative trend is reflected in the performance of attempted breakouts this week. Cup and handle pattern breakouts, which usually deliver the best returns, failed to deliver a positive result on average Although it's not a good marketing message for the site, I suggest extreme caution before going long until the trend reverses. 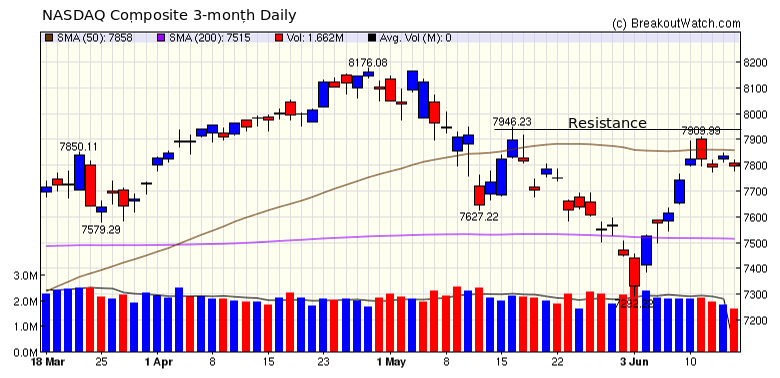 |
| No new features this week |
|
Our latest strategy
suggestions are here.
|
| List | Breakouts | Avg. Gain |
|---|---|---|
| CWH | 5 | -0.02 |
| SQZ | 4 | 3.7 |
| HTF | 0 | |
| HSB | 0 | |
| DB | 0 |
| Brkout Date | Symbol | Base | Squeeze | Brkout Price | Brkout Day Close | RS Rank* | Last Close | Current % off BOP | Gain at Intraday High |
|---|---|---|---|---|---|---|---|---|---|
| 2019-06-11 | CRMD | SQZ | y | 7.41 | 7.95 | 99 | 8 | 7.96% | 11.47% |
| 2019-06-11 | BBL | SQZ | y | 46.81 | 48.35 | 84 | 48.22 | 3.01% | 4.12% |
| 2019-06-10 | REV | SQZ | y | 23.34 | 24.02 | 84 | 23.96 | 2.66% | 5.1% |
| 2019-06-11 | RILY | CWH | n | 20.75 | 21.13 | 81 | 21.05 | 1.45% | 2.07% |
| 2019-06-11 | LION | SQZ | y | 29.81 | 30.36 | 82 | 30.16 | 1.17% | 2.15% |
| 2019-06-10 | KMX | CWH | n | 81.59 | 82.36 | 90 | 82.04 | 0.55% | 2.13% |
| 2019-06-11 | SAH | CWH | n | 23.48 | 23.63 | 95 | 23.51 | 0.13% | 2.43% |
| 2019-06-10 | WMS | CWH | n | 30.97 | 31.3 | 82 | 31 | 0.1% | 2.29% |
| 2019-06-14 | VTR | CWH | n | 66.42 | 23.63 | 81 | 64.86 | -2.35% | -1.49% |
| *RS Rank on day before breakout. | |||||||||
| Symbol | BO Price |
BO Vol. |
Company | Industry | RS Rank |
Last Close |
|---|---|---|---|---|---|---|
| No stocks met our suggested screening factors for
our Cup and Handle Chart Pattern watchlist. See Revised Rules for Trading Cup and Handle Breakouts |
||||||
| Index | Value | Change Week | Change YTD | Trend1 |
|---|---|---|---|---|
| Dow | 26089.6 |
0.41% | 11.84% | Up |
| NASDAQ | 7796.66 |
0.7% | 17.5% | Down |
| S&P 500 | 2886.98 |
0.47% | 15.16% | Up |
|
1The Market Trend is derived from
our proprietary market model. The market model is described on
the site here.
2The site also shows industry rankings based on fundamentals, combined technical and fundamentals, and on price alone. The site also shows daily industry movements. |
||||
| 1 Week | 13 Weeks | 26 Weeks | Year-to-Date |
|---|---|---|---|
| NASDAQ Composite |
S&P 500 1.41 % |
NASDAQ Composite 12.82 % |
NASDAQ Composite 17.5 % |
| 1 Week | 3 Weeks | 13 Weeks | 26 Weeks |
|---|---|---|---|
| Insurance Brokers |
Insurance Brokers |
Foreign Utilities |
Auto Parts Stores |
| Toy & Hobby Stores 43 |
Manufactured Housing 97 |
Manufactured Housing 199 |
Music & Video Stores 209 |
| Charts of each industry rank and performance over 12 months are available on the site | |||
If you received this newsletter from a friend and you would like to receive it regularly please go to the BreakoutWatch.com site and you will then be able to register to receive the newsletter.
Copyright (c) 06/15/2019 NBIcharts, LLC dba BreakoutWatch.com. All
rights reserved.
" BreakoutWatch," the BreakoutWatch.com "eye" logo, and the slogan
"tomorrow's breakouts today" are service marks of NBIcharts LLC. All
other marks are the property of their respective owners, and are used
for descriptive purposes only.
BreakoutWatch is not affiliated with Investor's Business Daily or with Mr. William O'Neil. Our site, research and analysis is supported entirely by subscription and is free from advertising.