Breakoutwatch Weekly Summary 06/22/19
You are receiving this email because you are or were a BreakoutWatch.com subscriber, or have subscribed to our weekly newsletter. This newsletter summarizes the breakout events of the week and provides additional guidance that does not fit into our daily format. It is published each weekend.
| Our NASDAQ Trend Indicator Turns
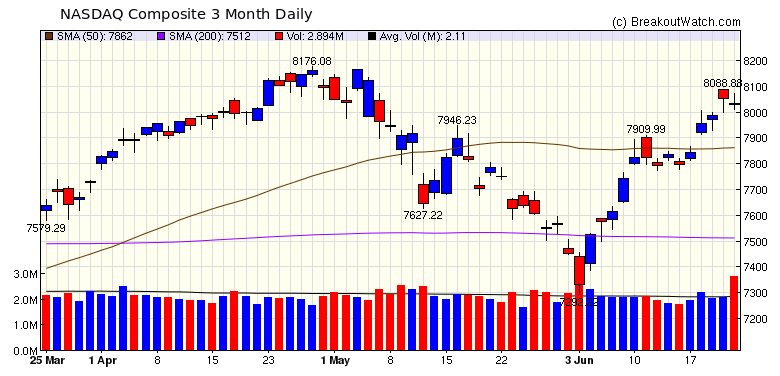
Positive; Number of Successful Breakouts Leap 3 Fold The NASDAQ Composite gapped up at Tuesday's open and closed for a 1.3% gain on well above average volume which caused our trend model for the NASDAQ to turn positive. The upward movement continued through Thursday as the market reacted to statements from the Fed implying that a rate cut could come soon in response to signs of weakening international and domestic economies. Volumes spiked on Friday due to it being a so called 'quadruple-witching' day and a 'doji' candlestick pattern showed uncertainty among buyers and sellers as to the future direction of stock prices. For the week, the NASDAQ Composite gained 3%, comfortably beating the DJI (2.4%) and S&P 500 (2.2%).  The strong performance of the
indexes, led to a surge in the number of successful breakouts
from 9 last week to 27 this week, a 3 fold increase. The
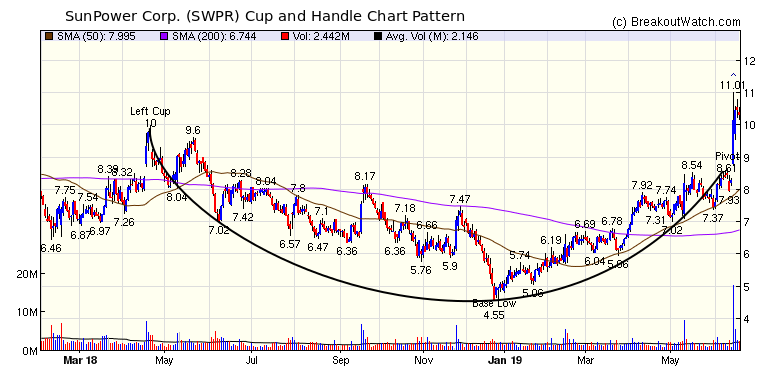
strongest performer was SunPower Corporation (SPWR) which closed
the week with a gain of 20.1%. SPWR has appeared several times
on our cup and handle pattern watchlist several times since it's
base bottomed in December last year. The chart is noticeable for
the length of the base (13 months) and the very short (2 day)
handle.
 |
| No new features this week |
|
Our latest strategy
suggestions are here.
|
| List | Breakouts | Avg. Gain |
|---|---|---|
| CWH | 10 | 3.95 |
| SQZ | 16 | 2.43 |
| HTF | 0 | |
| HSB | 0 | |
| DB | 1 | 4.71 |
| Brkout Date | Symbol | Base | Squeeze | Brkout Price | Brkout Day Close | RS Rank* | Last Close | Current % off BOP | Gain at Intraday High |
|---|---|---|---|---|---|---|---|---|---|
| 2019-06-18 | SPWR | CWH | n | 8.61 | 10.15 | 88 | 10.34 | 20.09% | 27.87% |
| 2019-06-19 | SNCR | SQZ | y | 7.36 | 7.82 | 89 | 7.99 | 8.56% | 11.96% |
| 2019-06-18 | RUN | SQZ | y | 17.10 | 18.27 | 91 | 18.52 | 8.3% | 12.75% |
| 2019-06-18 | ANIP | SQZ | y | 72.51 | 73.96 | 90 | 77.05 | 6.26% | 8.05% |
| 2019-06-19 | JYNT | SQZ | y | 16.34 | 16.91 | 98 | 17.35 | 6.18% | 13.22% |
| 2019-06-19 | GNE | CWH | y | 10.25 | 10.37 | 97 | 10.8 | 5.37% | 6.24% |
| 2019-06-20 | RPD | SQZ | y | 54.55 | 57.3 | 95 | 57.38 | 5.19% | 7.68% |
| 2019-06-19 | ADBE | DB | y | 285.87 | 291.21 | 74 | 299.33 | 4.71% | 6.34% |
| 2019-06-17 | TERP | SQZ | y | 13.89 | 14.04 | 89 | 14.43 | 3.89% | 4.32% |
| 2019-06-17 | BPMC | CWH | n | 91.80 | 94.44 | 91 | 95.17 | 3.67% | 9.76% |
| 2019-06-18 | SEDG | CWH | n | 57.88 | 58.56 | 92 | 59.4 | 2.63% | 5.32% |
| 2019-06-20 | JYNT | SQZ | y | 16.92 | 17.89 | 98 | 17.35 | 2.54% | 9.34% |
| 2019-06-18 | OFG | SQZ | y | 20.14 | 21.2 | 91 | 20.62 | 2.38% | 10.28% |
| 2019-06-19 | KAR | CWH | n | 61.08 | 61.6 | 85 | 62.53 | 2.37% | 3.43% |
| 2019-06-18 | FBM | SQZ | y | 15.84 | 16.36 | 93 | 16.21 | 2.34% | 4.86% |
| 2019-06-18 | KMPR | SQZ | y | 86.46 | 89.31 | 83 | 87.81 | 1.56% | 5.71% |
| 2019-06-19 | GSIT | CWH | n | 8.50 | 8.7 | 88 | 8.63 | 1.53% | 4.59% |
| 2019-06-17 | DISH | CWH | n | 38.47 | 38.99 | 82 | 39.01 | 1.4% | 7.59% |
| 2019-06-21 | EPZM | CWH | n | 14.81 | 14.97 | 95 | 14.97 | 1.08% | 2.16% |
| 2019-06-21 | KMX | CWH | n | 84.99 | 85.64 | 91 | 85.64 | 0.76% | 4.29% |
| 2019-06-20 | MODN | CWH | n | 19.66 | 20.1 | 86 | 19.78 | 0.61% | 2.59% |
| 2019-06-17 | AAT | SQZ | y | 47.26 | 47.36 | 83 | 47.49 | 0.49% | 1.8% |
| 2019-06-21 | RPD | SQZ | y | 57.31 | 57.38 | 96 | 57.38 | 0.12% | 2.5% |
| 2019-06-21 | WRB | SQZ | y | 66.82 | 66.88 | 92 | 66.88 | 0.09% | 0.96% |
| 2019-06-19 | JRS | SQZ | y | 10.59 | 10.65 | 81 | 10.47 | -1.13% | 0.57% |
| 2019-06-17 | NEXT | SQZ | y | 6.22 | 6.35 | 93 | 6.04 | -2.89% | 7.88% |
| 2019-06-18 | NEXT | SQZ | y | 6.36 | 6.49 | 89 | 6.04 | -5.03% | 5.5% |
| *RS Rank on day before breakout. | |||||||||
| Symbol | BO Price |
BO Vol. |
Company | Industry | RS Rank |
Last Close |
|---|---|---|---|---|---|---|
| EBR | 9.64 | 575,450 | Centrais Eletricas Brasileiras S.A. - Eletrobras | Electric Utilities | 98 | 9.00 |
| WSC | 14.87 | 749,632 | WillScot Corporation | Rental & Leasing Services | 89 | 14.51 |
| NAVI | 14.01 | 2,189,180 | Navient Corporation | Credit Services | 83 | 13.36 |
| QNST | 16.80 | 829,364 | QuinStreet - Inc. | Internet Software & Services | 83 | 16.18 |
| BSMX | 8.74 | 3,991,208 | Banco Santander | Foreign Regional Banks | 83 | 7.55 |
| LXP | 9.88 | 2,327,727 | Lexington Realty Trust | REIT - Diversified | 81 | 9.72 |
| CVA | 18.38 | 926,596 | Covanta Holding Corporation | Waste Management | 80 | 18.01 |
| These stocks meet our suggested screening factors
for our Cup and Handle Chart Pattern watchlist. See Revised Rules for Trading Cup and Handle Breakouts |
||||||
| Index | Value | Change Week | Change YTD | Trend1 |
|---|---|---|---|---|
| Dow | 26719.1 |
2.41% | 14.54% | Up |
| NASDAQ | 8031.71 |
3.01% | 21.05% | Up |
| S&P 500 | 2950.46 |
2.2% | 17.7% | Up |
|
1The Market Trend is derived from
our proprietary market model. The market model is described on
the site here.
2The site also shows industry rankings based on fundamentals, combined technical and fundamentals, and on price alone. The site also shows daily industry movements. |
||||
| 1 Week | 13 Weeks | 26 Weeks | Year-to-Date |
|---|---|---|---|
| NASDAQ Composite |
S&P 500 5.09 % |
NASDAQ Composite 26.82 % |
NASDAQ Composite 21.05 % |
| 1 Week | 3 Weeks | 13 Weeks | 26 Weeks |
|---|---|---|---|
| Insurance Brokers |
Insurance Brokers |
Foreign Utilities |
Auto Parts Stores |
| Beverages - Brewers 69 |
Manufactured Housing 103 |
Manufactured Housing 200 |
Music & Video Stores 210 |
| Charts of each industry rank and performance over 12 months are available on the site | |||
If you received this newsletter from a friend and you would like to receive it regularly please go to the BreakoutWatch.com site and you will then be able to register to receive the newsletter.
Copyright (c) 06/22/2019 NBIcharts, LLC dba BreakoutWatch.com. All
rights reserved.
" BreakoutWatch," the BreakoutWatch.com "eye" logo, and the slogan
"tomorrow's breakouts today" are service marks of NBIcharts LLC. All
other marks are the property of their respective owners, and are used
for descriptive purposes only.
BreakoutWatch is not affiliated with Investor's Business Daily or with Mr. William O'Neil. Our site, research and analysis is supported entirely by subscription and is free from advertising.