Breakoutwatch Weekly Summary 07/13/19
You are receiving this email because you are or were a BreakoutWatch.com subscriber, or have subscribed to our weekly newsletter. This newsletter summarizes the breakout events of the week and provides additional guidance that does not fit into our daily format. It is published each weekend.
| Volatility Squeeze Breakout
Backtest Available Again - Possible 84% gain in 2019 The NASDAQ started the week retreating from last Friday's high but was rejuvenated by Fed Chairman Powell's comments on Wednesday that were taken to mean that a rate cute of at least 0.25% will be made by the FOMC on July 31. The index continued to move upwards and closed at another new high on Friday, up 1%, although the move up was bested by the DJI that gained 1.5% which benefited from a 4.8% increase in oil prices. Briefing.com has an alternative take on the possibility of a rate cut as core inflation is rising: Fed officials have been pointing to weakening inflation metrics to justify the growing hopes for a rate cut, but economic data released this week showed a larger than expected increase in Core CPI (actual 0.3%; Briefing.com consensus 0.2%) and Core PPI (actual 0.3%; Briefing.com consensus 0.3%) in June. On a yr/yr basis, core CPI is up 2.1% while core PPI is up 2.3%. Meanwhile, the Fed's preferred inflation gauge, core PCE, increased 1.7% yr/yr in Q1, which is a faster rate than what was seen when the central bank began raising rates at the end of 2015 (1.2%). The upward price moves were not matched by an increase in volumes, as is typical in the summer months, and so the number of confirmed breakouts fell to just 4. 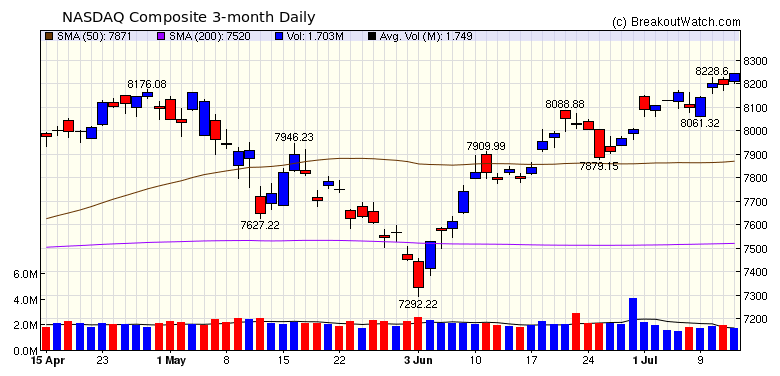 |
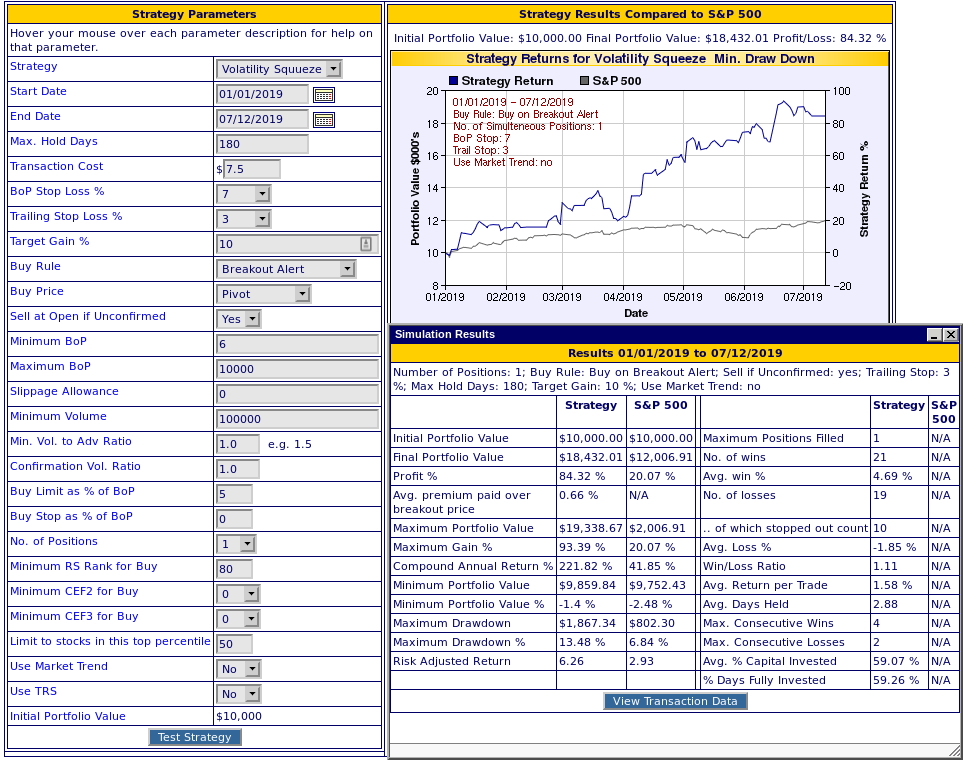
| Our Volatility Squeeze Backtest has been unavailable for some time as the data source for running the backtest was corrupted. I have corrected that now and the backtest is again available. The image below shows a sample backtest run for 2019 using a tight trailing stop (3%) and a modest target gain of 10%. This results in limiting losses and taking profits early. The backtest shows a potential profit of 84%. Click on the image to see a full screen version and notice the constraints on the backtest. In summary
 |
|
Our latest strategy
suggestions are here.
|
| List | Breakouts | Avg. Gain |
|---|---|---|
| CWH | 3 | -1.15 |
| SQZ | 1 | -3.47 |
| HTF | 0 | |
| HSB | 0 | |
| DB | 0 |
| Brkout Date | Symbol | Base | Squeeze | Brkout Price | Brkout Day Close | RS Rank* | Last Close | Current % off BOP | Gain at Intraday High |
|---|---|---|---|---|---|---|---|---|---|
| 2019-07-09 | IPHI | CWH | n | 54.11 | 54.81 | 95 | 58.75 | 8.58% | 9.06% |
| 2019-07-08 | VEC | CWH | n | 42.77 | 43.92 | 96 | 41.96 | -1.89% | 8.74% |
| 2019-07-11 | TNDM | SQZ | y | 65.99 | 67.11 | 98 | 63.7 | -3.47% | 6.68% |
| 2019-07-08 | CIR | CWH | n | 47.10 | 47.22 | 93 | 42.32 | -10.15% | 1.49% |
| *RS Rank on day before breakout. | |||||||||
| Symbol | BO Price |
BO Vol. |
Company | Industry | RS Rank |
Last Close |
|---|---|---|---|---|---|---|
| CRMD | 9.99 | 648,447 | CorMedix - Inc. | Biotechnology | 99 | 8.95 |
| ZYNE | 15.70 | 3,503,988 | Zynerba Pharmaceuticals - Inc. | Drugs - Generic | 99 | 13.64 |
| SNCR | 8.56 | 634,653 | Synchronoss Technologies - Inc. | Application Software | 94 | 8.11 |
| VCEL | 19.90 | 856,728 | Vericel Corporation | Biotechnology | 93 | 19.83 |
| BBD | 10.55 | 18,685,378 | Banco Bradesco S.A. | Foreign Regional Banks | 93 | 10.19 |
| SNR | 7.07 | 719,847 | New Senior Investment Group Inc. | Processing Systems & Products | 92 | 6.87 |
| MOBL | 6.39 | 1,388,540 | MobileIron - Inc. | Application Software | 90 | 6.23 |
| AG | 8.25 | 4,718,446 | First Majestic Silver Corp. | Silver | 87 | 7.80 |
| BKS | 6.95 | 4,052,346 | Barnes & Noble - Inc. | Specialty Retail - Other | 87 | 6.69 |
| TACO | 13.49 | 609,564 | Del Taco Restaurants - Inc. | Restaurants | 84 | 12.84 |
| These stocks meet our suggested screening factors
for our Cup and Handle Chart Pattern watchlist. See Revised Rules for Trading Cup and Handle Breakouts |
||||||
| Index | Value | Change Week | Change YTD | Trend1 |
|---|---|---|---|---|
| Dow | 27332 |
1.52% | 17.17% | Up |
| NASDAQ | 8244.14 |
1.01% | 24.25% | Up |
| S&P 500 | 3013.77 |
0.78% | 20.22% | Up |
|
1The Market Trend is derived from
our proprietary market model. The market model is described on
the site here.
2The site also shows industry rankings based on fundamentals, combined technical and fundamentals, and on price alone. The site also shows daily industry movements. |
||||
| 1 Week | 13 Weeks | 26 Weeks | Year-to-Date |
|---|---|---|---|
| Dow Jones |
S&P 500 3.26 % |
NASDAQ Composite 18.26 % |
NASDAQ Composite 24.25 % |
| 1 Week | 3 Weeks | 13 Weeks | 26 Weeks |
|---|---|---|---|
| Insurance Brokers |
Insurance Brokers |
Foreign Utilities |
Auto Parts Stores |
| Home Health Care 29 |
Agricultural Chemicals 61 |
Manufactured Housing 201 |
Music & Video Stores 210 |
| Charts of each industry rank and performance over 12 months are available on the site | |||
If you received this newsletter from a friend and you would like to receive it regularly please go to the BreakoutWatch.com site and you will then be able to register to receive the newsletter.
Copyright (c) 07/13/2019 NBIcharts, LLC dba BreakoutWatch.com. All
rights reserved.
" BreakoutWatch," the BreakoutWatch.com "eye" logo, and the slogan
"tomorrow's breakouts today" are service marks of NBIcharts LLC. All
other marks are the property of their respective owners, and are used
for descriptive purposes only.
BreakoutWatch is not affiliated with Investor's Business Daily or with Mr. William O'Neil. Our site, research and analysis is supported entirely by subscription and is free from advertising.