Breakoutwatch Weekly Summary 07/20/19
You are receiving this email because you are or were a BreakoutWatch.com subscriber, or have subscribed to our weekly newsletter. This newsletter summarizes the breakout events of the week and provides additional guidance that does not fit into our daily format. It is published each weekend.
| Geopolitical Tension and Rate Cut
Expectations Disappoint Markets The NASDAQ fell all week from Monday's new all time high as oil tanker seizures, drone shootings and heated rhetoric raised tensions with Iran. Thursday did bring a reversal as comments by New York Fed President Williams seemed to imply a 0.5% Fed Funds Rate cut was imminent but this was dashed on Friday by a Wall Street Journal report that the rate cut was more likely to be just 0.25%. The number of breakouts increased to 14 this week from just 3 last week with three of these closing over 10% higher. Cup and Handle pattern breakouts dominated with 9 0f the 14. 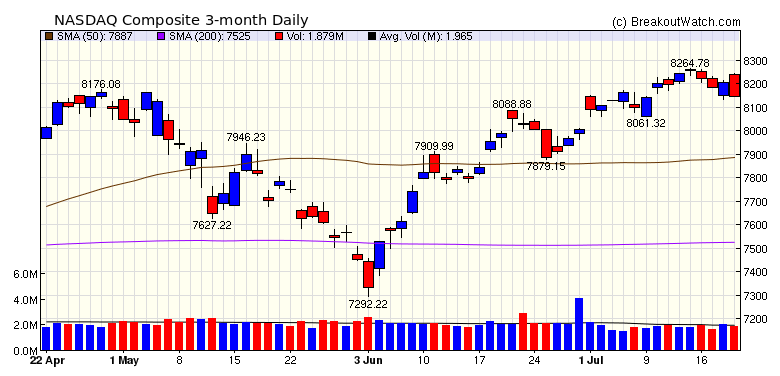 |
| No new features this week |
|
Our latest strategy
suggestions are here.
|
| List | Breakouts | Avg. Gain |
|---|---|---|
| CWH | 9 | 3.08 |
| SQZ | 4 | 2.69 |
| HTF | 0 | |
| HSB | 0 | |
| DB | 1 | 2.86 |
| Brkout Date | Symbol | Base | Squeeze | Brkout Price | Brkout Day Close | RS Rank* | Last Close | Current % off BOP | Gain at Intraday High |
|---|---|---|---|---|---|---|---|---|---|
| 2019-07-16 | AG | CWH | n | 8.25 | 8.57 | 90 | 9.9 | 20% | 24.12% |
| 2019-07-16 | ERII | CWH | n | 10.94 | 11.73 | 92 | 11.56 | 5.67% | 10.05% |
| 2019-07-18 | ACMR | SQZ | y | 17.33 | 19.03 | 94 | 18.26 | 5.37% | 10.22% |
| 2019-07-18 | JBSS | SQZ | y | 81.11 | 85.33 | 83 | 85.23 | 5.08% | 6.56% |
| 2019-07-15 | CYBR | DB | y | 135.58 | 141.47 | 97 | 139.46 | 2.86% | 6.34% |
| 2019-07-17 | FNF | CWH | n | 41.85 | 42.77 | 81 | 42.71 | 2.05% | 2.94% |
| 2019-07-18 | TMHC | CWH | n | 21.70 | 22.3 | 81 | 21.93 | 1.06% | 3.96% |
| 2019-07-15 | ICAD | SQZ | y | 6.56 | 6.92 | 97 | 6.61 | 0.76% | 7.47% |
| 2019-07-19 | CLF | CWH | n | 11.22 | 11.3 | 82 | 11.3 | 0.71% | 3.48% |
| 2019-07-18 | FISV | CWH | n | 95.42 | 96.87 | 84 | 95.39 | -0.03% | 1.9% |
| 2019-07-18 | NVS | CWH | n | 93.65 | 94.26 | 87 | 93.56 | -0.1% | 1.44% |
| 2019-07-17 | EBR | CWH | n | 10.50 | 10.64 | 98 | 10.48 | -0.19% | 3.05% |
| 2019-07-16 | LMRK | SQZ | y | 16.86 | 16.99 | 85 | 16.78 | -0.47% | 3.06% |
| 2019-07-16 | MIDD | CWH | n | 138.82 | 142.16 | 82 | 136.83 | -1.43% | 3% |
| *RS Rank on day before breakout. | |||||||||
| Symbol | BO Price |
BO Vol. |
Company | Industry | RS Rank |
Last Close |
|---|---|---|---|---|---|---|
| CRMD | 9.99 | 665,302 | CorMedix - Inc. | Biotechnology | 99 | 9.06 |
| AVID | 10.53 | 763,497 | Avid Technology - Inc. | Multimedia & Graphics Software | 98 | 9.95 |
| VCEL | 19.95 | 798,003 | Vericel Corporation | Biotechnology | 94 | 18.73 |
| SNR | 7.07 | 701,799 | New Senior Investment Group Inc. | Processing Systems & Products | 92 | 6.88 |
| BBD | 10.55 | 18,545,534 | Banco Bradesco S.A. | Foreign Regional Banks | 91 | 9.98 |
| BKS | 6.95 | 3,968,980 | Barnes & Noble - Inc. | Specialty Retail - Other | 91 | 6.69 |
| TGS | 16.69 | 1,068,702 | Transportadora de Gas del Sur S.A. | Gas Utilities | 90 | 15.20 |
| SNCR | 8.56 | 638,982 | Synchronoss Technologies - Inc. | Application Software | 90 | 7.37 |
| OMN | 10.04 | 857,529 | OMNOVA Solutions Inc. | Specialty Chemicals | 88 | 10.00 |
| DRNA | 16.95 | 632,100 | Dicerna Pharmaceuticals - Inc. | Biotechnology | 88 | 15.10 |
| These stocks meet our suggested screening factors
for our Cup and Handle Chart Pattern watchlist. See Revised Rules for Trading Cup and Handle Breakouts |
||||||
| Index | Value | Change Week | Change YTD | Trend1 |
|---|---|---|---|---|
| Dow | 27154.2 |
-0.65% | 16.4% | Up |
| NASDAQ | 8146.49 |
-1.18% | 22.78% | Up |
| S&P 500 | 2976.61 |
-1.23% | 18.74% | Up |
|
1The Market Trend is derived from
our proprietary market model. The market model is described on
the site here.
2The site also shows industry rankings based on fundamentals, combined technical and fundamentals, and on price alone. The site also shows daily industry movements. |
||||
| 1 Week | 13 Weeks | 26 Weeks | Year-to-Date |
|---|---|---|---|
| Dow Jones |
Dow Jones 1.64 % |
NASDAQ Composite 13.82 % |
NASDAQ Composite 22.78 % |
| 1 Week | 3 Weeks | 13 Weeks | 26 Weeks |
|---|---|---|---|
| Insurance Brokers |
Insurance Brokers |
Foreign Utilities |
Insurance Brokers |
| Personal Computers 173 |
Personal Computers 173 |
Manufactured Housing 194 |
Music & Video Stores 212 |
| Charts of each industry rank and performance over 12 months are available on the site | |||
If you received this newsletter from a friend and you would like to receive it regularly please go to the BreakoutWatch.com site and you will then be able to register to receive the newsletter.
Copyright (c) 07/20/2019 NBIcharts, LLC dba BreakoutWatch.com. All
rights reserved.
" BreakoutWatch," the BreakoutWatch.com "eye" logo, and the slogan
"tomorrow's breakouts today" are service marks of NBIcharts LLC. All
other marks are the property of their respective owners, and are used
for descriptive purposes only.
BreakoutWatch is not affiliated with Investor's Business Daily or with Mr. William O'Neil. Our site, research and analysis is supported entirely by subscription and is free from advertising.