Breakoutwatch Weekly Summary 07/27/19
You are receiving this email because you are or were a BreakoutWatch.com subscriber, or have subscribed to our weekly newsletter. This newsletter summarizes the breakout events of the week and provides additional guidance that does not fit into our daily format. It is published each weekend.
| New Highs and Positive Earnings
Yield Increasing Volume and Strong Cup and Handle Pattern
Breakouts The NASDAQ set a new high this week and with a gain of 2.3% comfortably outpaced the other two major indexes. Earnings season mostly produced better than expected earnings, which, along with anticipation of an interest rate cut next week, delivered 5 days of above average volumes. As we require a 50% increase in average volume to confirm a stock breakout, along with a close above breakout price, the number of confirmed breakouts increased from 14 to 18 this week. Cup and Handle breakouts were the most plentiful and also delivered the highest returns with an average gain of 4.3%. 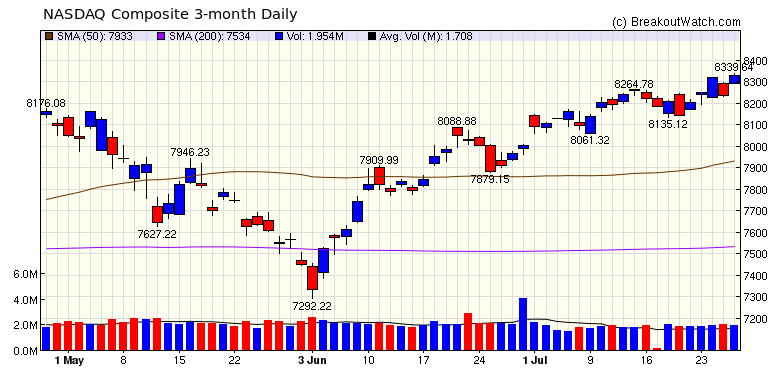 |
| No new features this week |
|
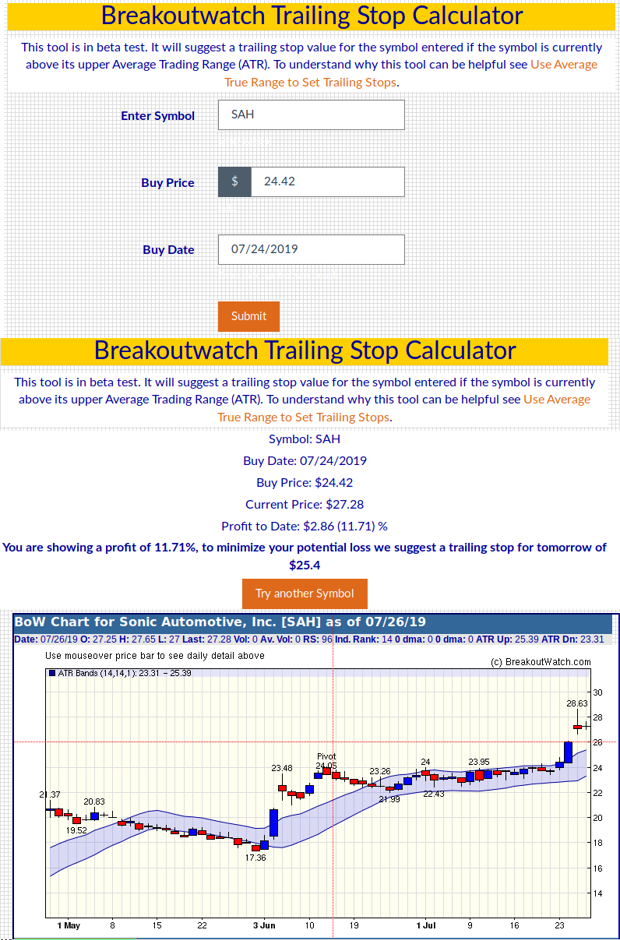
Set Trailing Stops with our
Trailing Stop Calculator
We have been advocating that you
use
Average True Range to set trailing stops for some time.
You may not be aware that we have a Trailing Stop Calculator
which is accessed from the Take Action - Alerts menu. To
illustrate it's use, consider the case of this week's top
breakout, SAH. By entering your stock symbol, buy price and
buy date, the tool will advise you what trailing stop should
be set for the next session. To get maximum benefit, of
course, you have to use the tool each day until the stock has
been sold.
 |
| List | Breakouts | Avg. Gain |
|---|---|---|
| CWH | 13 | 4.34 |
| SQZ | 4 | 3.41 |
| HTF | 0 | |
| HSB | 0 | |
| DB | 1 | 3.14 |
| Brkout Date | Symbol | Base | Squeeze | Brkout Price | Brkout Day Close | RS Rank* | Last Close | Current % off BOP | Gain at Intraday High |
|---|---|---|---|---|---|---|---|---|---|
| 2019-07-24 | SAH | SQZ | y | 24.42 | 26.02 | 96 | 27.28 | 11.71% | 17.24% |
| 2019-07-23 | HAS | CWH | n | 111.76 | 119.31 | 87 | 123.67 | 10.66% | 11.25% |
| 2019-07-23 | AUDC | CWH | n | 17.24 | 18.09 | 95 | 18.79 | 8.99% | 9.34% |
| 2019-07-24 | SLAB | CWH | n | 107.90 | 113.74 | 83 | 114.39 | 6.01% | 6.46% |
| 2019-07-24 | TMUS | CWH | n | 80.00 | 80.61 | 81 | 84.25 | 5.31% | 6.53% |
| 2019-07-24 | BCO | CWH | n | 88.57 | 92.96 | 86 | 92.8 | 4.78% | 5.92% |
| 2019-07-25 | KNL | CWH | n | 23.82 | 24.7 | 80 | 24.89 | 4.49% | 8.69% |
| 2019-07-24 | TRK | CWH | n | 19.04 | 19.82 | 90 | 19.8 | 3.99% | 4.41% |
| 2019-07-24 | CSGS | CWH | n | 49.86 | 50.57 | 89 | 51.84 | 3.97% | 4.53% |
| 2019-07-25 | NVRO | SQZ | y | 63.34 | 64.44 | 88 | 65.41 | 3.27% | 4.69% |
| 2019-07-26 | SPSC | DB | n | 110.00 | 113.45 | 80 | 113.45 | 3.14% | 7.53% |
| 2019-07-24 | NVTA | CWH | n | 24.96 | 25.01 | 98 | 25.66 | 2.8% | 4.3% |
| 2019-07-24 | MRVL | CWH | n | 26.65 | 27.17 | 92 | 27.33 | 2.55% | 3.71% |
| 2019-07-22 | JYNT | CWH | n | 20.00 | 20.68 | 99 | 20.42 | 2.1% | 8.95% |
| 2019-07-25 | SRI | SQZ | y | 33.60 | 33.91 | 82 | 33.98 | 1.13% | 2.02% |
| 2019-07-25 | ALGT | CWH | n | 152.00 | 152.01 | 83 | 152.63 | 0.41% | 3.62% |
| 2019-07-24 | WMS | CWH | n | 33.40 | 33.43 | 90 | 33.53 | 0.39% | 1.23% |
| 2019-07-22 | USAC | SQZ | y | 18.45 | 18.84 | 86 | 17.99 | -2.49% | 2.98% |
| *RS Rank on day before breakout. | |||||||||
| Symbol | BO Price |
BO Vol. |
Company | Industry | RS Rank |
Last Close |
|---|---|---|---|---|---|---|
| VCEL | 19.95 | 714,936 | Vericel Corporation | Biotechnology | 93 | 19.27 |
| VG | 13.05 | 4,656,228 | Vonage Holdings Corp. | Diversified Communication Services | 90 | 12.50 |
| OMN | 10.04 | 979,654 | OMNOVA Solutions Inc. | Specialty Chemicals | 90 | 9.95 |
| BKS | 6.95 | 3,934,887 | Barnes & Noble - Inc. | Specialty Retail - Other | 90 | 6.55 |
| SA | 14.84 | 601,726 | Seabridge Gold Inc. | Gold | 83 | 13.96 |
| TACO | 13.50 | 559,592 | Del Taco Restaurants - Inc. | Restaurants | 82 | 12.42 |
| NAVI | 15.67 | 2,645,373 | Navient Corporation | Credit Services | 81 | 14.08 |
| SBLK | 11.56 | 799,000 | Star Bulk Carriers Corp. | Shipping | 80 | 10.40 |
| These stocks meet our suggested screening factors
for our Cup and Handle Chart Pattern watchlist. See Revised Rules for Trading Cup and Handle Breakouts |
||||||
| Index | Value | Change Week | Change YTD | Trend1 |
|---|---|---|---|---|
| Dow | 27192.4 |
0.14% | 16.57% | Up |
| NASDAQ | 8330.21 |
2.26% | 25.54% | Up |
| S&P 500 | 3025.86 |
1.65% | 20.7% | Up |
|
1The Market Trend is derived from
our proprietary market model. The market model is described on
the site here.
2The site also shows industry rankings based on fundamentals, combined technical and fundamentals, and on price alone. The site also shows daily industry movements. |
||||
| 1 Week | 13 Weeks | 26 Weeks | Year-to-Date |
|---|---|---|---|
| NASDAQ Composite |
S&P 500 2.26 % |
NASDAQ Composite 16.26 % |
NASDAQ Composite 25.54 % |
| 1 Week | 3 Weeks | 13 Weeks | 26 Weeks |
|---|---|---|---|
| Insurance Brokers |
Insurance Brokers |
Foreign Utilities |
Insurance Brokers |
| Toys & Games 55 |
Personal Computers 117 |
Manufactured Housing 199 |
Music & Video Stores 212 |
| Charts of each industry rank and performance over 12 months are available on the site | |||
If you received this newsletter from a friend and you would like to receive it regularly please go to the BreakoutWatch.com site and you will then be able to register to receive the newsletter.
Copyright (c) 07/27/2019 NBIcharts, LLC dba BreakoutWatch.com. All
rights reserved.
" BreakoutWatch," the BreakoutWatch.com "eye" logo, and the slogan
"tomorrow's breakouts today" are service marks of NBIcharts LLC. All
other marks are the property of their respective owners, and are used
for descriptive purposes only.
BreakoutWatch is not affiliated with Investor's Business Daily or with Mr. William O'Neil. Our site, research and analysis is supported entirely by subscription and is free from advertising.