Breakoutwatch Weekly Summary 10/05/19
You are receiving this email because you are or were a BreakoutWatch.com subscriber, or have subscribed to our weekly newsletter. This newsletter summarizes the breakout events of the week and provides additional guidance that does not fit into our daily format. It is published each weekend.
| Trend Indicators Turn Negative;
Revised Industry Classification Our trend indicators turned negative for the three major indexes on Monday. The indicator for the Dow Jones Indus trials recovered on Friday following a positive jobs report but the NASDAQ and S&P 500 remain negative. Last week I showed that the NASDAQ had completed a bearish Double Top pattern and the chart still shows that the bearish signal is still in effect. Heavy selling for all major indexes on Tuesday and Wednesday followed the ISM manufacturing index falling to its lowest level since June 2009. Thursday started with a continuing decline leading to an oversold position but the NASDAQ found support at the 200 day moving average level and the index closed higher following short sale covering. Friday's gap up followed the positive employment report but volume levels were well below the 50 day average showing residual fear that a correction is looming. Note that the best performing industries are Utilities indicating that there is a move towards defensive stock positions. The negative trend for the week inevitably meant that there were very few breakouts. 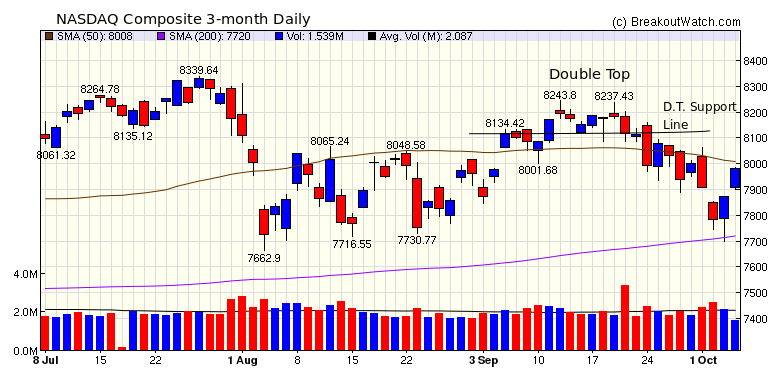 |
| No new features this week, however I have reviewed the industry data I provide and found a number of anomalies. Among these were:
|
|
Our latest strategy
suggestions are here.
|
| List | Breakouts | Avg. Gain |
|---|---|---|
| CWH | 3 | 0.9 |
| SQZ | 1 | -0.09 |
| HTF | 0 | |
| HSB | 0 | |
| DB | 0 |
| Brkout Date | Symbol | Base | Squeeze | Brkout Price | Brkout Day Close | RS Rank* | Last Close | Current % off BOP | Gain at Intraday High |
|---|---|---|---|---|---|---|---|---|---|
| 2019-10-04 | FORM | CWH | n | 19.74 | 20.34 | 93 | 20.34 | 3.04% | 3.14% |
| 2019-10-04 | HUBG | CWH | y | 47.40 | 47.52 | 83 | 47.52 | 0.25% | 1.58% |
| 2019-09-30 | ZF | SQZ | y | 11.14 | 47.52 | 86 | 11.13 | -0.09% | -0.09% |
| 2019-09-30 | NHS | CWH | y | 12.13 | 0 | 80 | 12.06 | -0.58% | -0.58% |
| *RS Rank on day before breakout. | |||||||||
| Symbol | BO Price |
BO Vol. |
Company | Industry | RS Rank |
Last Close |
|---|---|---|---|---|---|---|
| ALDR | 18.95 | 4,300,284 | Alder BioPharmaceuticals - Inc. | Biotechnology | 97 | 18.90 |
| AKTS | 8.77 | 670,330 | Akoustis Technologies - Inc. | Communication Equipment | 92 | 7.95 |
| CZR | 12.03 | 16,776,519 | Caesars Entertainment Corporation | Resorts & Casinos | 88 | 11.66 |
| PLAB | 11.45 | 690,910 | Photronics - Inc. | Semiconductor Equipment & Materials | 87 | 10.85 |
| PSDO | 16.96 | 1,925,121 | Presidio - Inc. | Information Technology | 87 | 16.79 |
| CORT | 15.03 | 1,117,971 | Corcept Therapeutics Incorporated | Biotechnology | 86 | 14.19 |
| VRRM | 15.10 | 1,340,434 | Verra Mobility Corporation - Class A Common Stock | Security & Protection Services | 85 | 13.97 |
| WSC | 16.89 | 722,250 | WillScot Corporation | Rental & Leasing Services | 85 | 15.57 |
| SONO | 15.41 | 2,407,084 | Sonos - Inc. | Electronic Equipment | 84 | 13.39 |
| TTMI | 12.63 | 1,614,963 | TTM Technologies - Inc. | Printed Circuit Boards | 81 | 12.29 |
| These stocks meet our suggested screening factors
for our Cup and Handle Chart Pattern watchlist. See Revised Rules for Trading Cup and Handle Breakouts |
||||||
| Index | Value | Change Week | Change YTD | Trend1 |
|---|---|---|---|---|
| Dow | 26573.7 |
-0.92% | 13.92% | Up |
| NASDAQ | 7982.47 |
0.54% | 20.3% | Down |
| S&P 500 | 2952.01 |
-0.33% | 17.76% | Down |
|
1The Market Trend is derived from
our proprietary market model. The market model is described on
the site here.
2The site also shows industry rankings based on fundamentals, combined technical and fundamentals, and on price alone. The site also shows daily industry movements. |
||||
| 1 Week | 13 Weeks | 26 Weeks | Year-to-Date |
|---|---|---|---|
| NASDAQ Composite |
S&P 500 -1.28 % |
S&P 500 2.05 % |
NASDAQ Composite 20.3 % |
| 1 Week | 3 Weeks | 13 Weeks | 26 Weeks |
|---|---|---|---|
| Electric Utilities |
Diversified Utilities |
Water Utilities |
Insurance Brokers |
| Medical Practitioners 190 |
Consumer Services 182 |
Personal Computers 187 |
Drug Delivery 180 |
| Charts of each industry rank and performance over 12 months are available on the site | |||
If you received this newsletter from a friend and you would like to receive it regularly please go to the BreakoutWatch.com site and you will then be able to register to receive the newsletter.
Copyright (c) 10/05/2019 NBIcharts, LLC dba BreakoutWatch.com. All
rights reserved.
" BreakoutWatch," the BreakoutWatch.com "eye" logo, and the slogan
"tomorrow's breakouts today" are service marks of NBIcharts LLC. All
other marks are the property of their respective owners, and are used
for descriptive purposes only.
BreakoutWatch is not affiliated with Investor's Business Daily or with Mr. William O'Neil. Our site, research and analysis is supported entirely by subscription and is free from advertising.