Breakoutwatch Weekly Summary 11/16/19
You are receiving this email because you are or were a BreakoutWatch.com subscriber, or have subscribed to our weekly newsletter. This newsletter summarizes the breakout events of the week and provides additional guidance that does not fit into our daily format. It is published each weekend.
| New Highs for Major Indexes;
Breakout Count Jumps to 18; Volatility Squeeze Analysis If it's Friday, then there must be an announcement that a trade agreement with China is close to being reached, and the market will react with a move higher. In this case, it was to set a new record for the NASDAQ, DJI and S&P 500. Friday's advance came after a week in which there was only sideways movement and even after Friday's jump, the NASDAQ gained only 0.8%, lagging the DJI (1.2%) and the S&P 500 (0.9%). 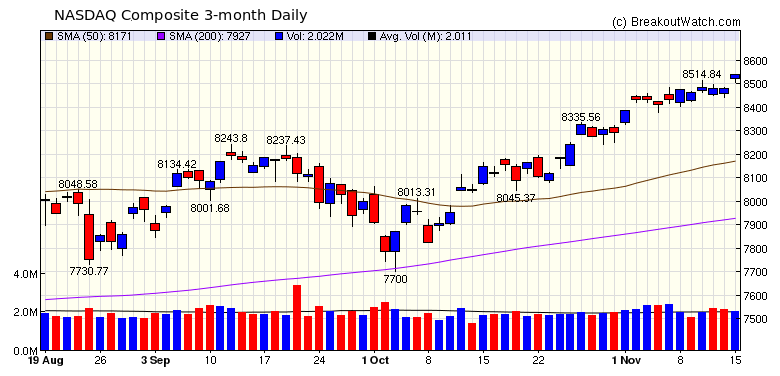 The number of breakouts jumped to
18 after just 4 last week. The Volatility Squeeze pattern
produced 10 breakouts with an average gain of 3% and the Cup and
Handle pattern produced 8 breakouts with an average gain of just
1.5%.
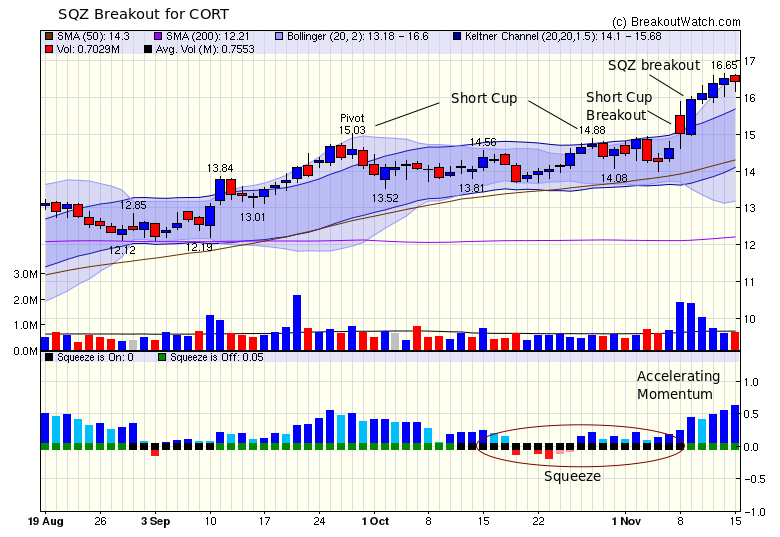
While INFN was the best performing
SQZ breakout, the second best, CORT, showed an interesting
pattern. The day before the SQZ breakout, it had broken out of a
cup and handle pattern with a short cup, 22 days, less than the
required 30 for consideration as a true cup and handle. The SQZ
breakout followed the next day. Note the well above average and
accelerating momentum as the squeeze progressed.
 |
| No new features this week |
|
Our latest strategy
suggestions are here.
|
| List | Breakouts | Avg. Gain |
|---|---|---|
| CWH | 8 | 1.5 |
| SQZ | 10 | 3.03 |
| HTF | 0 | |
| HSB | 0 | |
| DB | 0 |
| Brkout Date | Symbol | Base | Squeeze | Brkout Price | Brkout Day Close | RS Rank* | Last Close | Current % off BOP | Gain at Intraday High |
|---|---|---|---|---|---|---|---|---|---|
| 2019-11-14 | INFN | SQZ | y | 6.01 | 6.36 | 95 | 6.71 | 11.65% | 12.31% |
| 2019-11-11 | CORT | SQZ | y | 15.02 | 15.93 | 88 | 16.44 | 9.45% | 10.85% |
| 2019-11-12 | CRSP | CWH | n | 52.28 | 53.58 | 90 | 56.87 | 8.78% | 9.79% |
| 2019-11-12 | TTD | SQZ | y | 217.02 | 223.85 | 85 | 229.15 | 5.59% | 7.54% |
| 2019-11-15 | AUDC | CWH | n | 22.20 | 23.42 | 97 | 23.42 | 5.5% | 7.88% |
| 2019-11-11 | AY | SQZ | y | 24.54 | 24.7 | 88 | 25.79 | 5.09% | 5.18% |
| 2019-11-12 | DRNA | CWH | n | 18.39 | 19.46 | 96 | 19.3 | 4.95% | 13.59% |
| 2019-11-12 | WSC | SQZ | y | 16.64 | 16.67 | 87 | 17.43 | 4.75% | 4.75% |
| 2019-11-12 | APPS | CWH | n | 7.78 | 8.29 | 99 | 7.96 | 2.31% | 9.38% |
| 2019-11-12 | FWONK | SQZ | y | 42.62 | 43.15 | 83 | 43.57 | 2.23% | 3.4% |
| 2019-11-14 | GDS | CWH | n | 44.27 | 44.54 | 92 | 44.35 | 0.18% | 2.1% |
| 2019-11-12 | ABDC | SQZ | y | 9.00 | 9.02 | 89 | 9 | 0% | 0.44% |
| 2019-11-11 | TIPT | SQZ | y | 7.69 | 7.84 | 91 | 7.62 | -0.91% | 4.55% |
| 2019-11-12 | MRVL | CWH | n | 27.47 | 28.07 | 91 | 26.86 | -2.22% | 3.29% |
| 2019-11-12 | HLIT | CWH | n | 8.11 | 8.23 | 92 | 7.9 | -2.59% | 3.21% |
| 2019-11-12 | TIPT | SQZ | y | 7.85 | 7.93 | 92 | 7.62 | -2.93% | 2.42% |
| 2019-11-11 | NXST | SQZ | y | 105.96 | 108.3 | 80 | 101.03 | -4.65% | 2.86% |
| 2019-11-12 | PI | CWH | n | 35.99 | 36.25 | 93 | 34.23 | -4.89% | 5.45% |
| *RS Rank on day before breakout. | |||||||||
| Symbol | BO Price |
BO Vol. |
Company | Industry | RS Rank |
Last Close |
|---|---|---|---|---|---|---|
| RUHN | 7.46 | 816,724 | Ruhnn Holding Limited - American Depositary Shares | Specialty Retail | 95 | 6.75 |
| COLL | 19.99 | 670,239 | Collegium Pharmaceutical - Inc. | Drug Manufacturers - Specialty & Generic | 94 | 18.12 |
| FLEX | 12.38 | 7,601,637 | Flex Ltd. - Ordinary Shares | Contract Manufacturers | 89 | 12.18 |
| MNTA | 16.89 | 689,096 | Momenta Pharmaceuticals - Inc. | Drug Manufacturers - Specialty & Generic | 88 | 16.03 |
| FLXN | 17.82 | 882,300 | Flexion Therapeutics - Inc. | Drug Manufacturers - Specialty & Generic | 88 | 16.09 |
| ZNGA | 6.47 | 25,444,982 | Zynga Inc. - Class A Common Stock | Electronic Gaming & Multimedia | 88 | 6.28 |
| SONO | 15.21 | 1,883,814 | Sonos - Inc. | Consumer Electronics | 87 | 14.50 |
| TILE | 17.43 | 533,244 | Interface - Inc. | Textile Manufacturing | 84 | 16.37 |
| QNST | 15.62 | 921,177 | QuinStreet - Inc. | Internet Content & Information | 82 | 15.20 |
| These stocks meet our suggested screening factors
for our Cup and Handle Chart Pattern watchlist. See Revised Rules for Trading Cup and Handle Breakouts |
||||||
| Index | Value | Change Week | Change YTD | Trend1 |
|---|---|---|---|---|
| Dow | 28004.9 |
1.17% | 20.05% | Up |
| NASDAQ | 8540.83 |
0.77% | 28.72% | Up |
| S&P 500 | 3120.46 |
0.89% | 24.48% | Up |
|
1The Market Trend is derived from
our proprietary market model. The market model is described on
the site here.
2The site also shows industry rankings based on fundamentals, combined technical and fundamentals, and on price alone. The site also shows daily industry movements. |
||||
| 1 Week | 13 Weeks | 26 Weeks | Year-to-Date |
|---|---|---|---|
| Dow Jones 1.17 % |
Dow Jones 8.17 % |
NASDAQ Composite 9.27 % |
NASDAQ Composite 28.72 % |
| 1 Week | 3 Weeks | 13 Weeks | 26 Weeks |
|---|---|---|---|
| Electric Utilities |
Electric Utilities |
Water Utilities |
Insurance Brokers |
| Home Improvement Stores 143 |
Home Improvement Stores 143 |
Movie Production - Theaters 194 |
Drug Delivery 179 |
| Charts of each industry rank and performance over 12 months are available on the site | |||
If you received this newsletter from a friend and you would like to receive it regularly please go to the BreakoutWatch.com site and you will then be able to register to receive the newsletter.
Copyright (c) 11/16/2019 NBIcharts, LLC dba BreakoutWatch.com. All
rights reserved.
" BreakoutWatch," the BreakoutWatch.com "eye" logo, and the slogan
"tomorrow's breakouts today" are service marks of NBIcharts LLC. All
other marks are the property of their respective owners, and are used
for descriptive purposes only.
BreakoutWatch is not affiliated with Investor's Business Daily or with Mr. William O'Neil. Our site, research and analysis is supported entirely by subscription and is free from advertising.