Breakoutwatch Weekly Summary 12/07/19
You are receiving this email because you are or were a BreakoutWatch.com subscriber, or have subscribed to our weekly newsletter. This newsletter summarizes the breakout events of the week and provides additional guidance that does not fit into our daily format. It is published each weekend.
| Good Week for Breakouts. Strategy
Suggestions: Real Time Alerts Tutorial The NASDAQ gave up just 0.1% this week after being saved by a stronger than expected jobs report on Friday. The week began badly when Trump suggested a trade deal with China could wait until after the 2020 election and the ISM Manufacturing index for November was weaker than expected. The decline was arrested on Wednesday when the good old chestnut of trade talks nearing a deal was trotted out and the indexes started to recover. The recovery which began on Tuesday delivered 14 breakouts by Friday's close. The cup and handle pattern watchlist delivered 8breakouts averaging 4.7% and the Volatility Squeeze pattern delivered 6 breakouts averaging 4.2%. Friday's action gave me an opportunity to demonstrate how our real time alerts page on the site can be used to time an entry into a position. See Strategy Suggestions below. 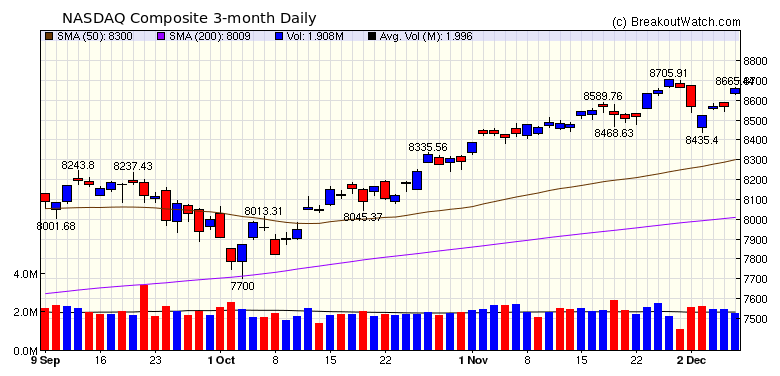 |
| Obtain a T/A Chart from an
intraday chart When clicking on a symbol in our Alerts Issued Today page an intraday chart is shown with price and volume data. There is now a button that will show a 3-month T/A chart which puts the intraday chart into perspective. I've produced a tutorial on how to benefit from this below. |
|
Our latest strategy
suggestions are here.
Tutorial: How to Use Intraday
Chart to time an entry.
The images below show how to time
your entry from watching the Alerts Issued Today page. (These
images were captured after the close of business. In real time
you would see the intraday chart as at the time you looked).
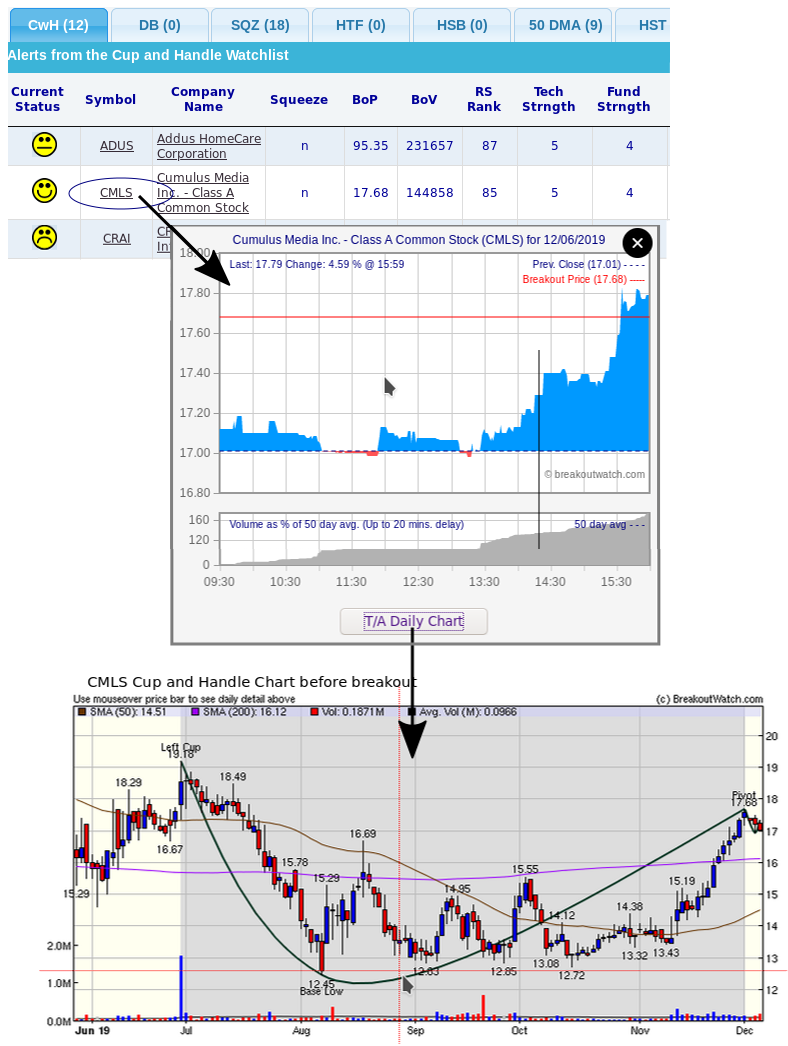
1. Cup and Handle Example
On the Alerts page, the smiley
under the 'Current Status column indicates where the stock is
situated following breakout. The first three smikeys shown
below indicate ADUS is still above its breakout price. CRAI
has fallen below its breakout price, and CMLS is both above
its breakout price and above the breakout volume requirement.
When you see that happy smiley face, its time to click on the
symbol and an intraday chart will pop up. The actual time at
which the happy smiley appears is shown by the vertical line I
imposed on the chart.
We see that indeed the stock is
above its breakout price and the 150% volume requirement is
met. Now it's time to click on the T/A Daily chart button.
The daily chart shows that prior
to today, the stock has been ascending the right side of the
cup quite rapidly before profit taking set the pivot and the
stock formed a handle. The rapid rise shows a lot of buyer
interest - which could continue after the breakout, and the
intraday chart shows the breakout could be a strong one. This
could therefor be an excellenttime to make an entry.
 2. Volatility Squeeze Breakout
Let's look at an example of a
Volatility Squeeze example. As above we open the intraday
chart when we see the happy Smiley Face. In this case the
volume requirement is only 100% of the 50 day average and the
verticle line I superimposed shows the point at which the
smiley turned happy. Looking at the T/A Chart shows that there
was strong buyer interest in the days prior to breakout which
may indicate that the breakout will continue.
 Caveat
These two example indicate how
you can use the Alerts page, smiley indicators, intraday and
T/A charts to assist your buying decision. There are no
guarantees however that trades made following these
suggestions will ultimately be profitable. To limit you risk
after entering a trade I suggest you use our Trailing
Stop Calculator to set a trailing stop.
|
| List | Breakouts | Avg. Gain |
|---|---|---|
| CWH | 8 | 4.69 |
| SQZ | 6 | 4.19 |
| HTF | 0 | |
| HSB | 0 | |
| DB | 0 |
| Brkout Date | Symbol | Base | Squeeze | Brkout Price | Brkout Day Close | RS Rank* | Last Close | Current % off BOP | Gain at Intraday High |
|---|---|---|---|---|---|---|---|---|---|
| 2019-12-06 | ZUMZ | SQZ | y | 30.57 | 35.47 | 91 | 35.47 | 16.03% | 16.72% |
| 2019-12-05 | POWL | CWH | n | 42.88 | 45.43 | 85 | 49.04 | 14.37% | 14.55% |
| 2019-12-06 | EPZM | CWH | n | 17.00 | 18.22 | 94 | 18.22 | 7.18% | 8.18% |
| 2019-12-06 | IMMU | CWH | n | 19.52 | 20.59 | 94 | 20.59 | 5.48% | 7.17% |
| 2019-12-02 | EVFM | CWH | n | 6.55 | 6.86 | 92 | 6.88 | 5.04% | 14.5% |
| 2019-12-04 | RUSHA | CWH | n | 46.32 | 47.82 | 86 | 47.64 | 2.85% | 4.53% |
| 2019-12-02 | ICAD | SQZ | y | 7.52 | 7.7 | 95 | 7.71 | 2.53% | 5.45% |
| 2019-12-06 | NFE | SQZ | y | 16.24 | 16.62 | 80 | 16.62 | 2.34% | 3.53% |
| 2019-12-04 | CATS | SQZ | y | 17.02 | 17.29 | 91 | 17.36 | 2% | 3.88% |
| 2019-12-06 | FTDR | SQZ | y | 45.33 | 45.97 | 86 | 45.97 | 1.41% | 2.01% |
| 2019-12-03 | IOVA | CWH | n | 24.38 | 24.5 | 97 | 24.72 | 1.39% | 2.54% |
| 2019-12-06 | PSMT | SQZ | y | 74.07 | 74.7 | 88 | 74.7 | 0.85% | 1.16% |
| 2019-12-04 | TTMI | CWH | n | 13.71 | 13.72 | 88 | 13.8 | 0.66% | 1.17% |
| 2019-12-06 | CMLS | CWH | n | 17.68 | 17.77 | 85 | 17.77 | 0.51% | 0.96% |
| *RS Rank on day before breakout. | |||||||||
| Symbol | BO Price |
BO Vol. |
Company | Industry | RS Rank |
Last Close |
|---|---|---|---|---|---|---|
| AFIN | 15.18 | 895,182 | American Finance Trust - Inc. | REIT - Diversified | 90 | 14.42 |
| ASUR | 9.42 | 646,629 | Asure Software Inc | Software - Application | 89 | 8.13 |
| NUAN | 18.19 | 3,917,754 | Nuance Communications - Inc. | Software - Application | 85 | 17.89 |
| These stocks meet our suggested screening factors
for our Cup and Handle Chart Pattern watchlist. See Revised Rules for Trading Cup and Handle Breakouts |
||||||
| Index | Value | Change Week | Change YTD | Trend1 |
|---|---|---|---|---|
| Dow | 28015.1 |
-0.13% | 20.09% | Up |
| NASDAQ | 8656.53 |
-0.1% | 30.46% | Up |
| S&P 500 | 3145.91 |
0.16% | 25.49% | Up |
|
1The Market Trend is derived from
our proprietary market model. The market model is described on
the site here.
2The site also shows industry rankings based on fundamentals, combined technical and fundamentals, and on price alone. The site also shows daily industry movements. |
||||
| 1 Week | 13 Weeks | 26 Weeks | Year-to-Date |
|---|---|---|---|
| S&P 500 0.16 % |
NASDAQ Composite 6.83 % |
NASDAQ Composite 11.81 % |
NASDAQ Composite 30.46 % |
| 1 Week | 3 Weeks | 13 Weeks | 26 Weeks |
|---|---|---|---|
| Electric Utilities |
Electric Utilities |
Water Utilities |
Water Utilities |
| Computer Peripherals 58 |
Textile Industrial 102 |
Drug Delivery 203 |
Drug Delivery 206 |
| Charts of each industry rank and performance over 12 months are available on the site | |||
If you received this newsletter from a friend and you would like to receive it regularly please go to the BreakoutWatch.com site and you will then be able to register to receive the newsletter.
Copyright (c) 12/07/2019 NBIcharts, LLC dba BreakoutWatch.com. All
rights reserved.
" BreakoutWatch," the BreakoutWatch.com "eye" logo, and the slogan
"tomorrow's breakouts today" are service marks of NBIcharts LLC. All
other marks are the property of their respective owners, and are used
for descriptive purposes only.
BreakoutWatch is not affiliated with Investor's Business Daily or with Mr. William O'Neil. Our site, research and analysis is supported entirely by subscription and is free from advertising.