Breakoutwatch Weekly Summary 12/14/19
You are receiving this email because you are or were a BreakoutWatch.com subscriber, or have subscribed to our weekly newsletter. This newsletter summarizes the breakout events of the week and provides additional guidance that does not fit into our daily format. It is published each weekend.
| New Record Highs. TGTX Double
Breakout Tutorial. For a summary of the major events driving this weeks market action see the Weekly Wrap. The NASDAQ Composite set a new intraday high on Thursday on above average volume and finished the week 0.9% higher, outperforming the S&P 500 (0.7%) and the DJI (0.4%). 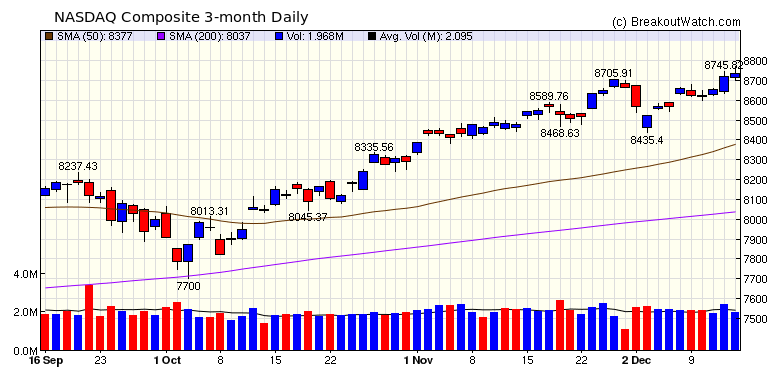 The number of breakouts remained
steady at 13 with gains being a modest average 1% for cup and
handle breakouts and a loss of 0.6% for Volatility Squeeze
breakouts. Anyone who jumped on the squeeze breakout of TGTX on
Tuesday was further rewarded on Friday with another breakout
after the stock had formed a 2 day handle and qualified as a cup
and handle pattern. See below for an analysis of the double
breakout.
|
| The intraday charts accessed from the Alerts page now shows the intraday volume level needed for a confirmed breakout. 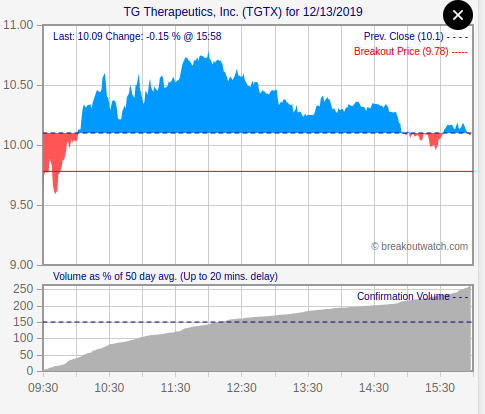 |
|
Our latest strategy
suggestions are here.
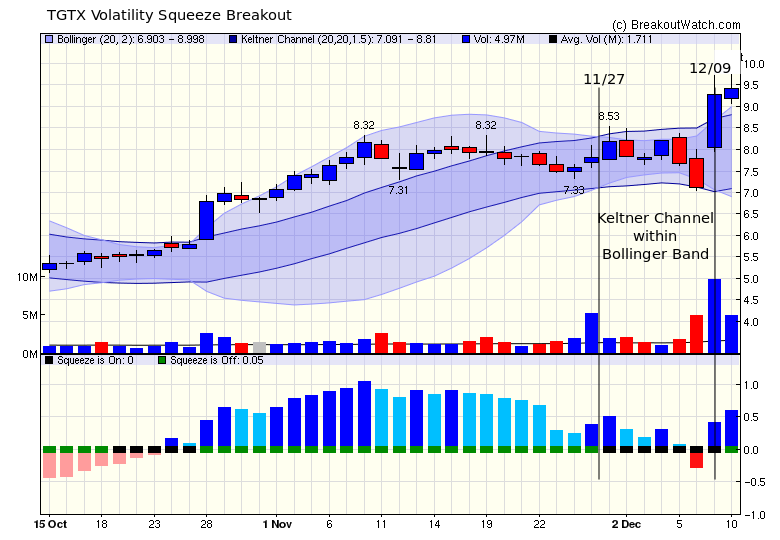
TGTX Double Breakout
TGTX entered a volatility squeeze
on 11/27 when the Keltner Channel fell inside the Bollinger
Channel. However, because we require positive and accelerating
momentum before entering a stock onto our Volatility Squeeze
watchlist, we did not put it onto the SQZ watchlist until
12/09 when volume spiked to 6 times the 50 day average and
momentum became positive. The next day (12/10) the squeeze
came off and TGTX made a Volatility Squeeze breakout.
(To understand how to read a chart for stocks in a volatility
squeeze see here)
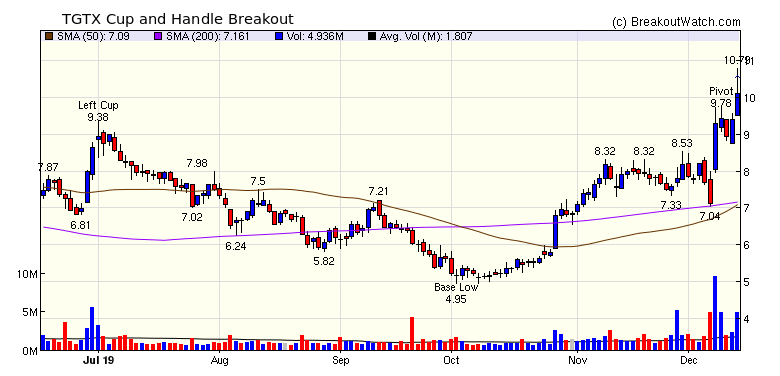
 In making the breakout, the
closing price set a pivot on a 6 month cup and handle pattern
and appeared on the CWH watchlist on 12/12 having set a 2 day
handle. Note that the volume on 12/12 was again higher than
the 50 day average, indicating there were many interested
buyers. The stock then broke out the next day, 12/13/19.
Note that in both cases the
volume prior to breakout was indicative that a breakout could
occur.
 |
| List | Breakouts | Avg. Gain |
|---|---|---|
| CWH | 8 | 1.02 |
| SQZ | 5 | -0.6 |
| HTF | 0 | |
| HSB | 0 | |
| DB | 0 |
| Brkout Date | Symbol | Base | Squeeze | Brkout Price | Brkout Day Close | RS Rank* | Last Close | Current % off BOP | Gain at Intraday High |
|---|---|---|---|---|---|---|---|---|---|
| 2019-12-10 | TGTX | SQZ | y | 9.29 | 9.42 | 95 | 10.1 | 8.72% | 16.09% |
| 2019-12-13 | QURE | CWH | n | 70.00 | 73.97 | 95 | 73.97 | 5.67% | 5.71% |
| 2019-12-12 | MU | SQZ | y | 49.27 | 50.97 | 84 | 51.2 | 3.92% | 6.19% |
| 2019-12-13 | TGTX | CWH | n | 9.78 | 10.1 | 95 | 10.1 | 3.27% | 10.28% |
| 2019-12-13 | YNDX | CWH | n | 42.25 | 43.25 | 81 | 43.25 | 2.37% | 2.37% |
| 2019-12-12 | ASYS | CWH | n | 6.38 | 6.41 | 82 | 6.53 | 2.35% | 3.37% |
| 2019-12-13 | NGM | CWH | n | 18.49 | 18.67 | 81 | 18.67 | 0.97% | 7.19% |
| 2019-12-09 | VCTR | CWH | n | 20.95 | 21 | 94 | 20.7 | -1.19% | 5.97% |
| 2019-12-11 | ASPU | CWH | n | 7.44 | 7.5 | 92 | 7.28 | -2.15% | 7.53% |
| 2019-12-12 | HAIN | SQZ | y | 25.54 | 25.79 | 84 | 24.965 | -2.25% | 1.45% |
| 2019-12-12 | AVGO | CWH | y | 325.67 | 327.8 | 80 | 315.42 | -3.15% | 1.38% |
| 2019-12-09 | VRA | SQZ | y | 11.63 | 12.11 | 80 | 11.08 | -4.73% | 9.29% |
| 2019-12-11 | ARCT | SQZ | y | 10.84 | 10.85 | 97 | 9.9 | -8.67% | 5.26% |
| *RS Rank on day before breakout. | |||||||||
| Symbol | BO Price |
BO Vol. |
Company | Industry | RS Rank |
Last Close |
|---|---|---|---|---|---|---|
| GLDD | 11.94 | 602,024 | Great Lakes Dredge & Dock Corporation | Engineering & Construction | 91 | 11.63 |
| WSC | 18.30 | 728,740 | WillScot Corporation | Rental & Leasing Services | 90 | 17.22 |
| SSRM | 17.25 | 1,363,928 | SSR Mining Inc. | Gold | 88 | 16.84 |
| NAVI | 14.64 | 2,417,478 | Navient Corporation | Credit Services | 85 | 14.13 |
| RCM | 13.01 | 1,672,278 | R1 RCM Inc. | Health Information Services | 85 | 12.13 |
| LOCO | 16.65 | 629,967 | El Pollo Loco Holdings - Inc. | Restaurants | 84 | 15.35 |
| GPRE | 15.63 | 868,785 | Green Plains - Inc. | Specialty Chemicals | 82 | 15.17 |
| These stocks meet our suggested screening factors
for our Cup and Handle Chart Pattern watchlist. See Revised Rules for Trading Cup and Handle Breakouts |
||||||
| Index | Value | Change Week | Change YTD | Trend1 |
|---|---|---|---|---|
| Dow | 28135.4 |
0.43% | 20.61% | Up |
| NASDAQ | 8734.88 |
0.91% | 31.64% | Up |
| S&P 500 | 3168.8 |
0.73% | 26.41% | Up |
|
1The Market Trend is derived from
our proprietary market model. The market model is described on
the site here.
2The site also shows industry rankings based on fundamentals, combined technical and fundamentals, and on price alone. The site also shows daily industry movements. |
||||
| 1 Week | 13 Weeks | 26 Weeks | Year-to-Date |
|---|---|---|---|
| NASDAQ Composite 0.91 % |
NASDAQ Composite 6.83 % |
NASDAQ Composite 12.03 % |
NASDAQ Composite 31.64 % |
| 1 Week | 3 Weeks | 13 Weeks | 26 Weeks |
|---|---|---|---|
| Electric Utilities |
Electric Utilities |
Water Utilities |
Auto Dealerships |
| Technical & System Software 66 |
Gas Utilities 93 |
Electronics Stores 192 |
Publishing - Books 196 |
| Charts of each industry rank and performance over 12 months are available on the site | |||
If you received this newsletter from a friend and you would like to receive it regularly please go to the BreakoutWatch.com site and you will then be able to register to receive the newsletter.
Copyright (c) 12/14/2019 NBIcharts, LLC dba BreakoutWatch.com. All
rights reserved.
" BreakoutWatch," the BreakoutWatch.com "eye" logo, and the slogan
"tomorrow's breakouts today" are service marks of NBIcharts LLC. All
other marks are the property of their respective owners, and are used
for descriptive purposes only.
BreakoutWatch is not affiliated with Investor's Business Daily or with Mr. William O'Neil. Our site, research and analysis is supported entirely by subscription and is free from advertising.