Breakoutwatch Weekly Summary 01/18/20
You are receiving this email because you are or were a BreakoutWatch.com subscriber, or have subscribed to our weekly newsletter. This newsletter summarizes the breakout events of the week and provides additional guidance that does not fit into our daily format. It is published each weekend.
| Cup and Handle Breakouts Average 7%
Gain,Volatility Squeeze Averages 5% The markets continued to set new all time highs bolstered by earnings reports, economic data and trade news. The NASDAQ outperformed the other major indexes rising 2.3% while the S&P 500 added 2% and the DJI 1.8%. 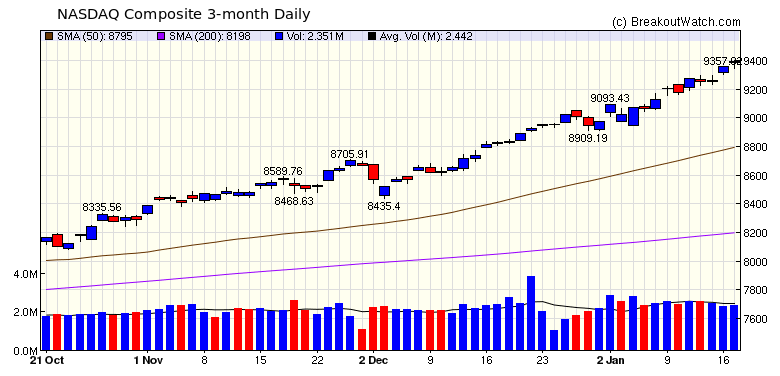 There were many strong breakouts this week, with the strongest being CYBE. The two charts below show the cup and handle base developed over almost 12 months. A significant clue to the coming breakout was the volume which was at or above the 50 day average since Jan 7 Even when the stock set its pivot on Jan 10, the volume dipped only slightly and remained above the 50 day average in the handle showing strong buying interest. Usually, the volume dips more significantly after the pivot is set. The proximate cause of the breakout was the announcement of a new product on Jan 16 which clearly had been highly anticipated. 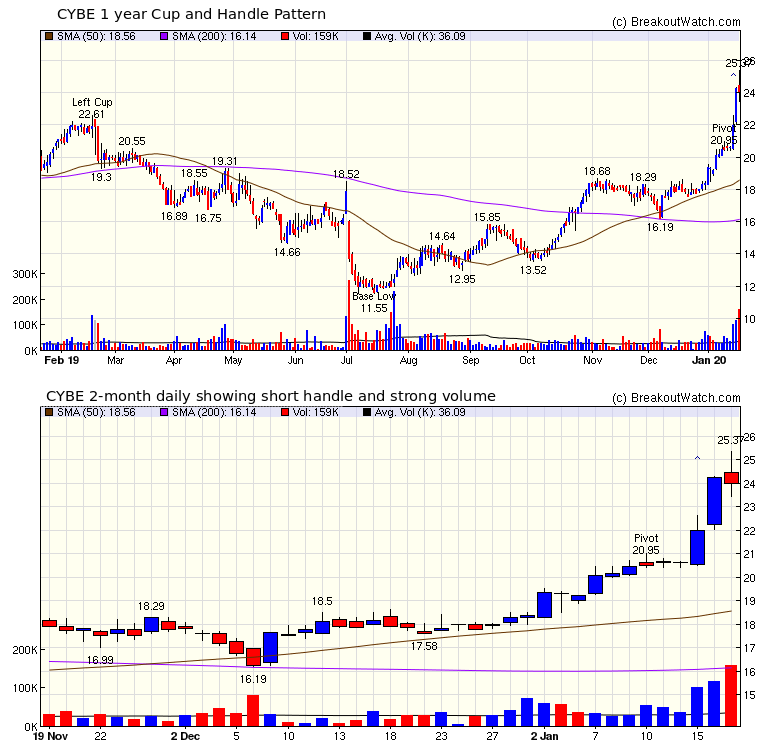 |
| No new features this week |
|
Our latest strategy
suggestions are here.
|
| List | Breakouts | Avg. Gain |
|---|---|---|
| CWH | 6 | 7.19 |
| SQZ | 12 | 5.09 |
| HTF | 0 | |
| HSB | 0 | |
| DB | 0 |
| Brkout Date | Symbol | Base | Squeeze | Brkout Price | Brkout Day Close | RS Rank* | Last Close | Current % off BOP | Gain at Intraday High |
|---|---|---|---|---|---|---|---|---|---|
| 2020-01-15 | CYBE | CWH | n | 20.95 | 22 | 90 | 24 | 14.56% | 21.1% |
| 2020-01-14 | FATE | CWH | n | 22.40 | 24.28 | 89 | 25.65 | 14.51% | 15.31% |
| 2020-01-16 | HSKA | SQZ | y | 98.00 | 106.39 | 83 | 107.93 | 10.13% | 13.16% |
| 2020-01-14 | CAMT | SQZ | y | 11.41 | 12.68 | 86 | 12.48 | 9.38% | 12.09% |
| 2020-01-13 | LVGO | SQZ | y | 27.01 | 28.55 | 93 | 29.45 | 9.03% | 17.81% |
| 2020-01-14 | PETS | SQZ | y | 25.40 | 26.89 | 91 | 27.26 | 7.32% | 8.7% |
| 2020-01-14 | RDVT | SQZ | y | 19.41 | 20.7 | 98 | 20.79 | 7.11% | 10.38% |
| 2020-01-15 | RDFN | SQZ | y | 22.37 | 23.95 | 84 | 23.52 | 5.14% | 8.94% |
| 2020-01-16 | GLPG | SQZ | y | 217.89 | 226.15 | 95 | 227.69 | 4.5% | 5.49% |
| 2020-01-17 | LSCC | CWH | n | 22.37 | 23.34 | 95 | 23.34 | 4.34% | 6.55% |
| 2020-01-14 | AVID | CWH | y | 8.82 | 8.94 | 85 | 9.16 | 3.85% | 8.28% |
| 2020-01-17 | QCOM | CWH | y | 92.73 | 95.91 | 88 | 95.91 | 3.43% | 3.71% |
| 2020-01-14 | LVGO | SQZ | y | 28.56 | 30.82 | 96 | 29.45 | 3.12% | 11.41% |
| 2020-01-14 | AEIS | CWH | y | 72.24 | 73.28 | 91 | 74.01 | 2.45% | 3.97% |
| 2020-01-17 | CLCT | SQZ | y | 24.31 | 24.83 | 80 | 24.83 | 2.14% | 2.71% |
| 2020-01-17 | GH | SQZ | y | 83.36 | 84.6 | 88 | 84.6 | 1.49% | 3.95% |
| 2020-01-13 | VRTS | SQZ | y | 126.72 | 128.25 | 90 | 128.33 | 1.27% | 2.86% |
| 2020-01-16 | ACHN | SQZ | y | 6.16 | 6.24 | 98 | 6.19 | 0.49% | 1.46% |
| *RS Rank on day before breakout. | |||||||||
| Symbol | BO Price |
BO Vol. |
Company | Industry | RS Rank |
Last Close |
|---|---|---|---|---|---|---|
| HABT | 14.10 | 783,190 | The Habit Restaurants - Inc. - Class A Common Stock | Restaurants | 93 | 13.92 |
| COOP | 14.12 | 768,212 | Mr. Cooper Group Inc. | Specialty Finance | 90 | 13.63 |
| CYTK | 13.27 | 1,609,212 | Cytokinetics - Incorporated | Biotechnology | 85 | 12.14 |
| RMBS | 14.57 | 823,474 | Rambus - Inc. | Semiconductor Memory | 83 | 14.37 |
| IRWD | 14.10 | 2,553,022 | Ironwood Pharmaceuticals - Inc. - Class A Common St | Drug Manufacturers - Specialty & Generic | 82 | 12.60 |
| SONO | 15.98 | 2,657,760 | Sonos - Inc. | Consumer Electronics | 81 | 15.12 |
| These stocks meet our suggested screening factors
for our Cup and Handle Chart Pattern watchlist. See Revised Rules for Trading Cup and Handle Breakouts |
||||||
| Index | Value | Change Week | Change YTD | Trend1 |
|---|---|---|---|---|
| Dow | 29348.1 |
1.82% | 2.84% | Up |
| NASDAQ | 9388.94 |
2.29% | 4.64% | Up |
| S&P 500 | 3329.62 |
1.97% | 3.06% | Up |
|
1The Market Trend is derived from
our proprietary market model. The market model is described on
the site here.
2The site also shows industry rankings based on fundamentals, combined technical and fundamentals, and on price alone. The site also shows daily industry movements. |
||||
| 1 Week | 13 Weeks | 26 Weeks | Year-to-Date |
|---|---|---|---|
| NASDAQ Composite 2.29 % |
NASDAQ Composite 16.06 % |
NASDAQ Composite 15.25 % |
NASDAQ Composite 4.64 % |
| 1 Week | 3 Weeks | 13 Weeks | 26 Weeks |
|---|---|---|---|
| Semiconductor Equipment &
Materials |
Semiconductor Equipment & Materials |
Electric Utilities |
Water Utilities |
| Personal Services 125 |
Personal Services 124 |
Home Improvement Stores 175 |
Drug Delivery 200 |
| Charts of each industry rank and performance over 12 months are available on the site | |||
If you received this newsletter from a friend and you would like to receive it regularly please go to the BreakoutWatch.com site and you will then be able to register to receive the newsletter.
Copyright (c) 01/18/2020 NBIcharts, LLC dba BreakoutWatch.com. All
rights reserved.
" BreakoutWatch," the BreakoutWatch.com "eye" logo, and the slogan
"tomorrow's breakouts today" are service marks of NBIcharts LLC. All
other marks are the property of their respective owners, and are used
for descriptive purposes only.
BreakoutWatch is not affiliated with Investor's Business Daily or with Mr. William O'Neil. Our site, research and analysis is supported entirely by subscription and is free from advertising.