Breakoutwatch Weekly Summary 01/25/20
You are receiving this email because you are or were a BreakoutWatch.com subscriber, or have subscribed to our weekly newsletter. This newsletter summarizes the breakout events of the week and provides additional guidance that does not fit into our daily format. It is published each weekend.
| Profit Taking after Health Fears;
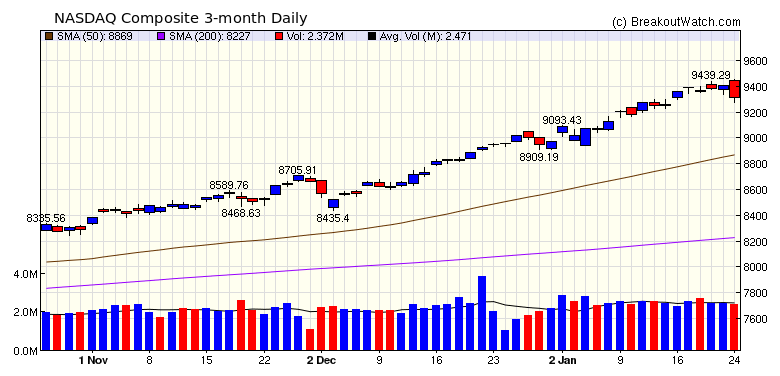
Volatility Squeeze Tutorial The major indexes set further new highs on Wednesday but fears that the spread of the coronavirus would slow economic activity led to profit taking on Friday in a market that was already fearing stocks were overvalued. The NASDAQ gave up 0.8% for the week but fared better than the DJI which slipped 1.2% and the S&P 500 1%.  Volatility Squeeze (SQZ) breakouts
substantially outperformed those from the cup and handle pattern
with an average gain of 5.3%. We examine the best performer
below.
|
|
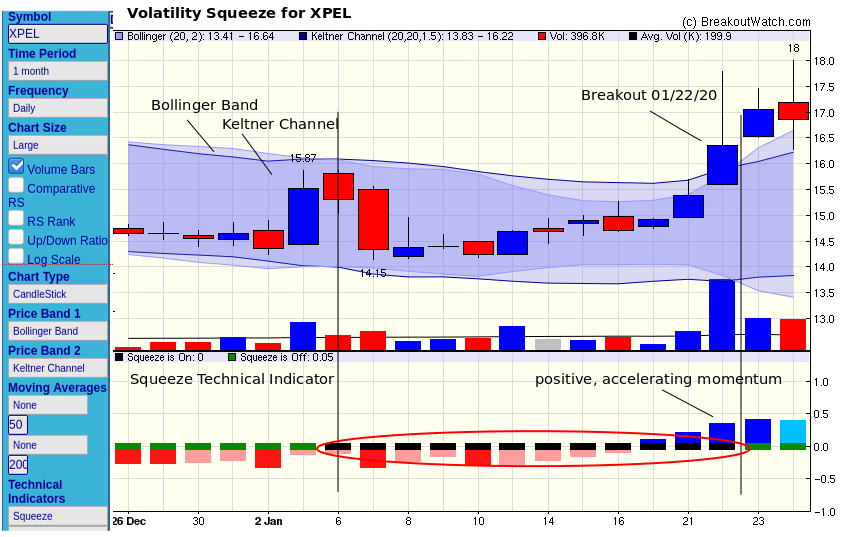
Volatility Squeze Breakout
of XPEL
A Volatility Squeeze (SQZ)
occurs when the volatility of a stock falls below previous
values. It is recognized when the Keltner channel falls
within the Bollinger Bands. The importance of the squeeze is
that it is expected that sooner or later volatility will
increase and the 'squeeze' will end resulting either in a
price move higher or lower. We look for squeeze situations
where the price is likely to move higher by firstly
recognizing a squeeze and then requiring that momentum must
be positive and increasing. If so, the stock is placed on
the Volatility Squeeze watchlist.
XPEL first appeared on the SQZ
list on Jan 15 Volume moved above the 50 day average on the
21st indicating the stock was under accumulation and the
breakout occurred the next day.
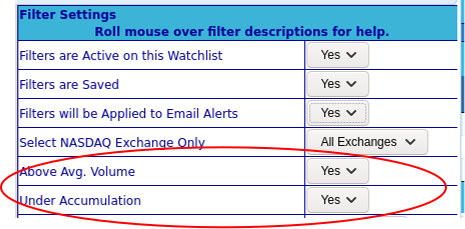
 Increasing volume is a sign that a breakout may be in the near future. This can be recognized by setting filters on the watchlist to look for stocks under accumulation with above average volume. This filter would have selected XPEL on Jan 21and an alert would be sent the next day.  |
| No new features this week |
|
Our latest strategy
suggestions are here.
|
| List | Breakouts | Avg. Gain |
|---|---|---|
| CWH | 4 | -0.17 |
| SQZ | 5 | 5.3 |
| HTF | 0 | |
| HSB | 0 | |
| DB | 0 |
| Brkout Date | Symbol | Base | Squeeze | Brkout Price | Brkout Day Close | RS Rank* | Last Close | Current % off BOP | Gain at Intraday High |
|---|---|---|---|---|---|---|---|---|---|
| 2020-01-22 | XPEL | SQZ | y | 15.40 | 16.35 | 94 | 16.85 | 9.42% | 16.82% |
| 2020-01-22 | EYE | SQZ | y | 33.79 | 35.04 | 82 | 36.76 | 8.79% | 13.97% |
| 2020-01-23 | EYE | SQZ | y | 35.05 | 35.57 | 86 | 36.76 | 4.88% | 9.87% |
| 2020-01-24 | TEAM | CWH | n | 140.49 | 146.79 | 80 | 146.79 | 4.48% | 7.19% |
| 2020-01-23 | RMBS | CWH | y | 14.57 | 14.78 | 81 | 14.94 | 2.54% | 3.57% |
| 2020-01-22 | NWPX | SQZ | y | 33.58 | 33.85 | 86 | 34.36 | 2.32% | 6.19% |
| 2020-01-24 | PCYO | SQZ | y | 12.82 | 12.96 | 81 | 12.96 | 1.09% | 1.79% |
| 2020-01-22 | STNE | CWH | n | 43.57 | 44.64 | 92 | 43.15 | -0.96% | 4.38% |
| 2020-01-23 | HOOK | CWH | n | 12.93 | 13.8 | 90 | 12.06 | -6.73% | 11.11% |
| *RS Rank on day before breakout. | |||||||||
| Symbol | BO Price |
BO Vol. |
Company | Industry | RS Rank |
Last Close |
|---|---|---|---|---|---|---|
| NERV | 9.23 | 659,564 | Minerva Neurosciences - Inc | Biotechnology | 93 | 8.01 |
| HABT | 14.10 | 790,880 | The Habit Restaurants - Inc. - Class A Common Stock | Restaurants | 93 | 13.95 |
| VNET | 11.25 | 574,101 | 21Vianet Group - Inc. - American Depositary Shares | Information Technology Services | 87 | 10.28 |
| MAT | 14.74 | 5,257,852 | Mattel - Inc. | Leisure | 85 | 14.28 |
| COOP | 14.12 | 763,530 | Mr. Cooper Group Inc. | Specialty Finance | 84 | 12.86 |
| AAOI | 15.98 | 1,003,854 | Applied Optoelectronics - Inc. | Semiconductors | 84 | 13.96 |
| CYTK | 13.27 | 1,263,918 | Cytokinetics - Incorporated | Biotechnology | 83 | 12.01 |
| TERP | 17.54 | 1,858,560 | TerraForm Power - Inc. - Class A Common Stock New | Utilities - Diversified | 83 | 17.31 |
| SONO | 15.98 | 2,507,373 | Sonos - Inc. | Consumer Electronics | 82 | 14.06 |
| SY | 14.89 | 885,963 | So-Young International Inc. - American Depository | Health Information Services | 81 | 13.15 |
| These stocks meet our suggested screening factors
for our Cup and Handle Chart Pattern watchlist. See Revised Rules for Trading Cup and Handle Breakouts |
||||||
| Index | Value | Change Week | Change YTD | Trend1 |
|---|---|---|---|---|
| Dow | 28989.7 |
-1.22% | 1.58% | Up |
| NASDAQ | 9314.91 |
-0.79% | 3.82% | Up |
| S&P 500 | 3295.47 |
-1.03% | 2% | Up |
|
1The Market Trend is derived from
our proprietary market model. The market model is described on
the site here.
2The site also shows industry rankings based on fundamentals, combined technical and fundamentals, and on price alone. The site also shows daily industry movements. |
||||
| 1 Week | 13 Weeks | 26 Weeks | Year-to-Date |
|---|---|---|---|
| NASDAQ Composite -0.79 % |
NASDAQ Composite 13 % |
NASDAQ Composite 11.82 % |
NASDAQ Composite 3.82 % |
| 1 Week | 3 Weeks | 13 Weeks | 26 Weeks |
|---|---|---|---|
| REIT - Specialty 55 |
61 |
199 |
208 |
| Charts of each industry rank and performance over 12 months are available on the site | |||
If you received this newsletter from a friend and you would like to receive it regularly please go to the BreakoutWatch.com site and you will then be able to register to receive the newsletter.
Copyright (c) 01/25/2020 NBIcharts, LLC dba BreakoutWatch.com. All
rights reserved.
" BreakoutWatch," the BreakoutWatch.com "eye" logo, and the slogan
"tomorrow's breakouts today" are service marks of NBIcharts LLC. All
other marks are the property of their respective owners, and are used
for descriptive purposes only.
BreakoutWatch is not affiliated with Investor's Business Daily or with Mr. William O'Neil. Our site, research and analysis is supported entirely by subscription and is free from advertising.